Overview
DDOE's new analytics module delivers the information required to manage projects, data, and work, and helps to turn data into actionable insight for better project performance.
The new analytics platform is built from the ground up with the latest data architecture to deliver up-to-date information at minimal time.
For further analysis, data from each chart and table on the Analytics 2.0 page can be exported to a CSV file, so you can discover the information you need for your business and operations.
Learn about the Analytics Overview - SDK Version.
Analytics Structure
The analytics module has 5 main dashboards:
Progress: Shows the project progress in terms of work done, percentage of items in different statuses in the annotation and QA workflow, and annotations and labels created.
Performance: Shows work performance metrics such as total annotation time, average item time, average annotation time, and average number of annotations per item.
QA: Shows quality control related information, such as issues raised and fixed over time, average correction time, and more.
User Stats: Shows user related information, such as labeling actions, total and average time spent per label, and more.
Scores: Task Scores are quality metrics used to evaluate the accuracy and consistency of annotations completed within a task. They help measure annotator performance and ensure that annotation results meet the required quality standards.
Analytics Scope
The data displayed in the analytics metrics and graphs is in the context you, the user, want it to be:
Use the dropdown menus at the top of the page to define the scope of the analytics page by choosing the entire project, a specific dataset, task, or assignment.
Present analytics for all users or any combination of users (team).
Set the time period you wish to get analytics data for according to your needs (e.g., today, yesterday, the last 7 days, from the beginning of the project, etc.).
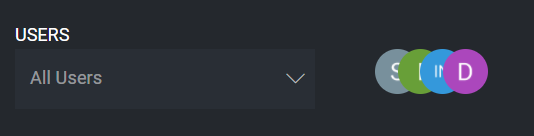
User Selection
By default, data is shown for all users. To change users selected, select a different option from the users drop-down menu. Select a combination of users by holding CTRL and clicking on the users you wish to include.
Time Range
Change the scope of time for which analytics data is presented by selecting specific dates.
Time Zone
UTC is the time zone used for the Analytics.
Analytics API Documentation
In the DDOE platform, we have an analytics screen where different metrics like Active users, Annotator's performance, Total working time, Item annotation time, etc. can be tracked at a project, dataset, or task level which would help the business.
To retrieve metrics from the API, you'll need to send a JSON payload containing the desired metrics and time period for analysis. This payload is essential for specifying which analytics data you want to track and analyze.