The Progress Analytics page helps you understand your current status in the selected dataset, task, or assignment context. On this screen, you can see the progress made with your data's labels and statuses, along with the number of annotations per label. While label information is available in dataset context only, status information is available in dataset/task/assignment scope.
Metrics
- Completed/Main Status – the current number of items in Completed or other main status (status created by the task creator in place of the default Completed main status), as well as their percentage out of the total number of items.
- Approved/Secondary – the current number of items in Approved or other secondary status (status created by the QA task creator in place of the default Approved status) status, as well as their percentage out of the total number of items.
- Discarded – the current number of items in Discarded status, as well as their percentage out of the total number of items.
- With issues – the current number of items with annotations with issues, as well as their percentage out of the total number of items. For more information about annotations issues as part of the QA process, read here.
- Corrected – the current number of items with annotations that are pending review, as well as their percentage out of the total number of items.
- Reviewed – the current number of items with annotations that have been reviewed, as well as their percentage out of the total number of items.
Graphs
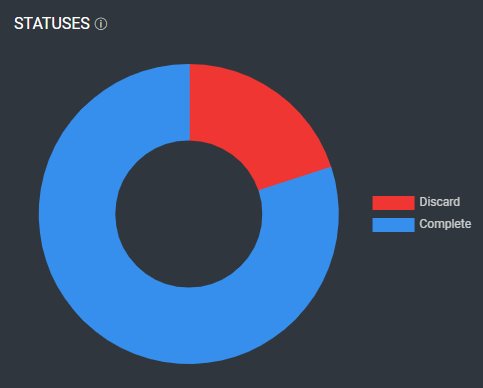
- Statuses – a donut chart that illustrates the portion of completed/discarded/approved items.

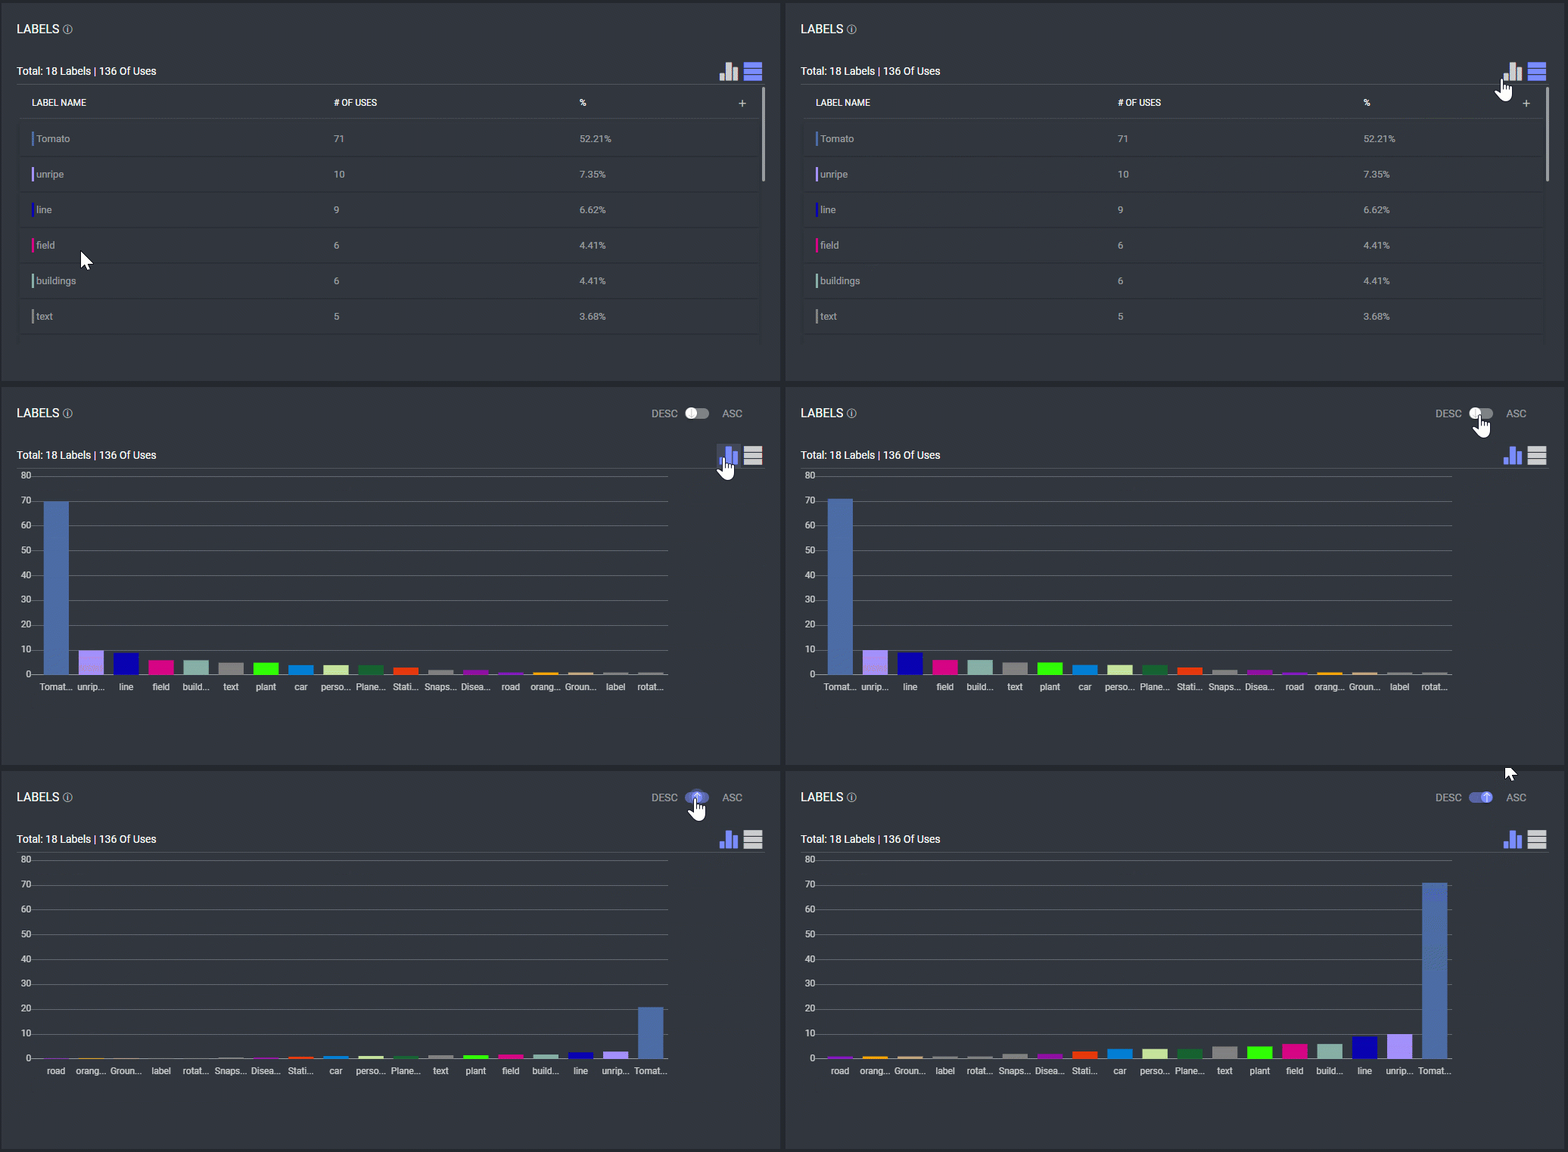
- Labels – the number of uses for each label and the usage percentage for each label out of the total number of label usage.
Click on the icon to see the information in a bar graph. Sort the labels in ascending/descending order to explore their dispersion.

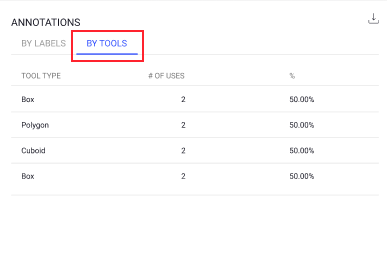
- Tools – The annotations table includes an additional tab - ‘By Tools’ (see below), detailing the annotations-tools used to create annotations (e.g. Polygon, Box, etc.)

This tab displays the following information summarized in columns:
- Tool type
- Number of uses
- % - the percentage of usage
Issues/For Review
This table lists items that are currently marked for review/with issues, with the number of issues and assignee shown for each item.
