QA analytics enable you to monitor issues raised on annotations and their correction over time, to measure the efficiency of your project’s QA process and your project’s quality.
To learn more about the QA workflow in the Dataloop platform, read here.
Metrics
- Total Issues Found – number of issues found for the given scope, regardless of their current state.
- Avg. Correction Time – Avg time of a full QA cycle, the time between raising an issue and when the item is finally approved.
- Avg. Issue Raise Time – the average time between creating an annotation and raising an issue on it.
- Avg. Resolve Time – the average time between raising an issue and correcting it (moving it to “for review“).
- Avg. Annotation Approval Time – the time between annotation correction (moving it to "for review") and approval.
Graphs
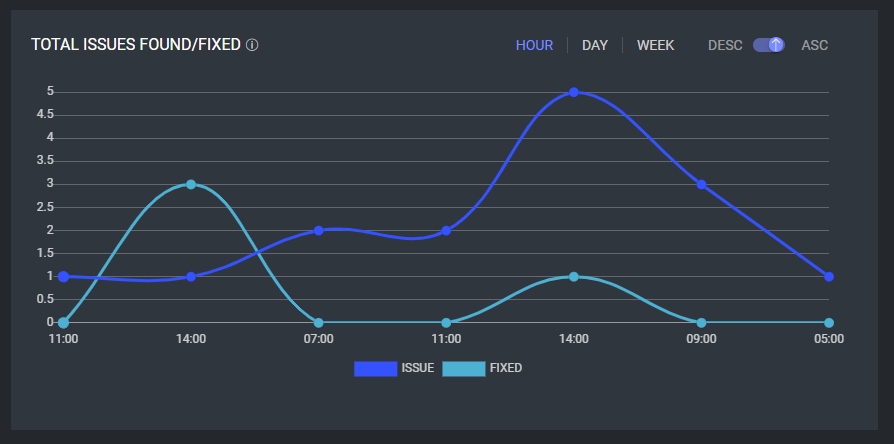
- Total Issues Found/Fixed – the number of issues found and fixed (approved) over a time period (per hour/day/week). Sort the information in ascending/descending order to view the most recent/oldest information.

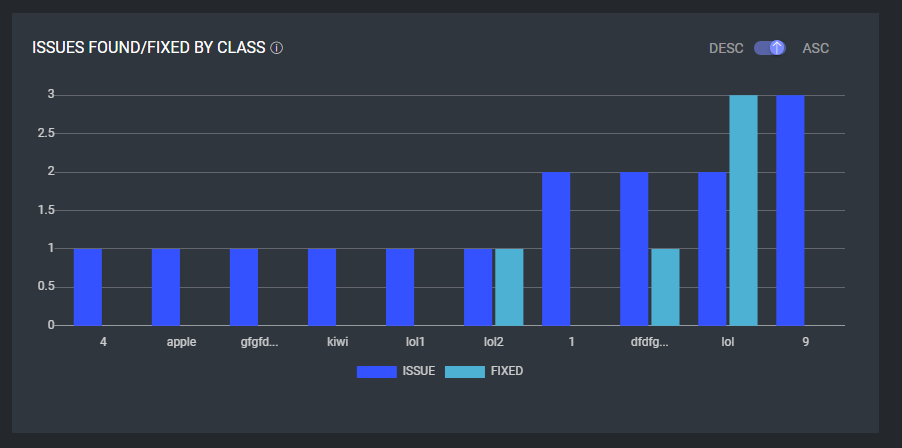
- Issues Found/Fixed by Class – the number of issues found and fixed (approved) per class (label). Sort the results in ascending/descending order to examine the classes that raise the most or the least issues.

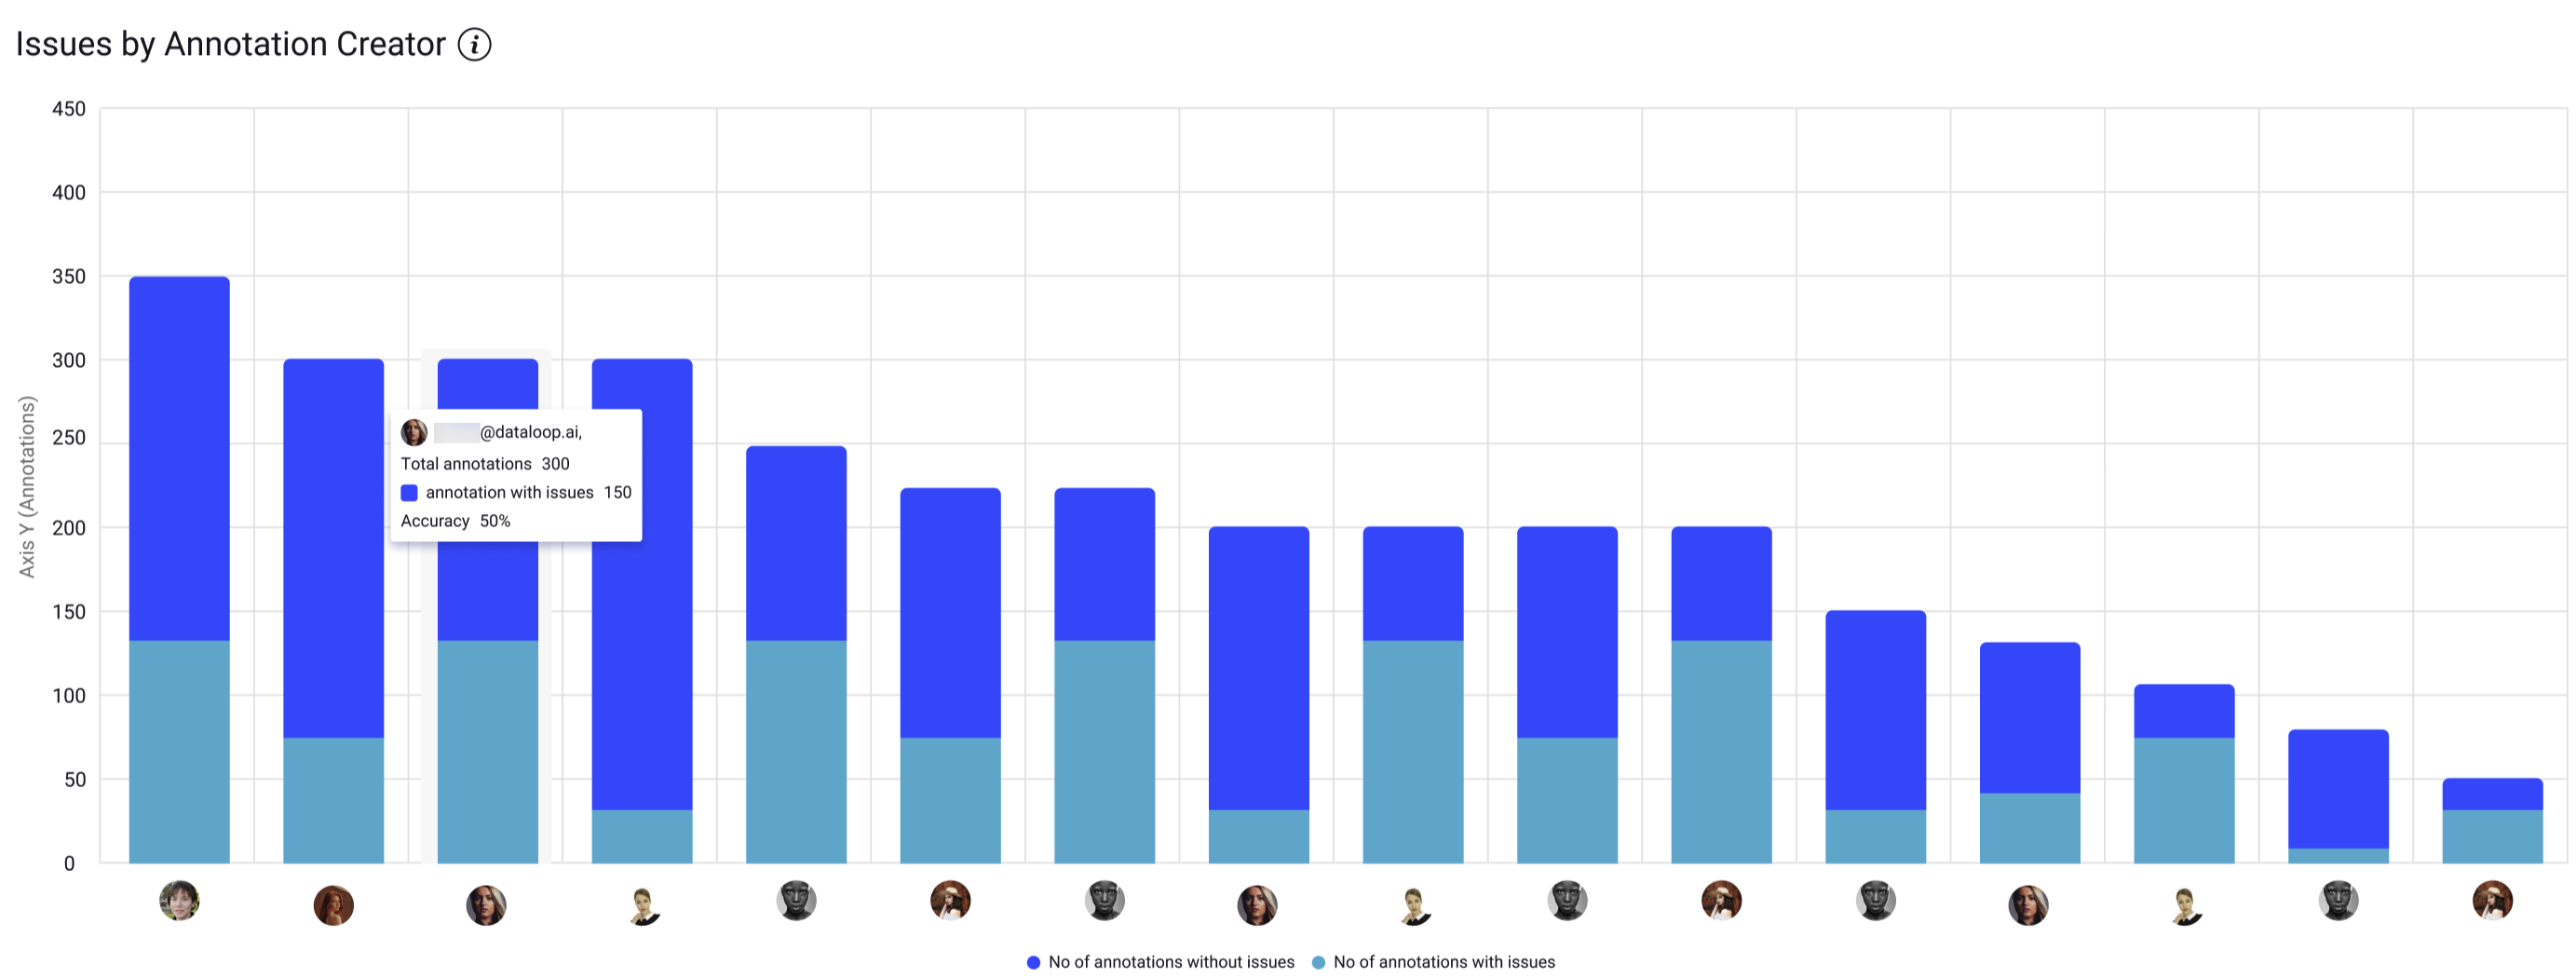
- Issues by Annotation Creator: This graph allows to analyze annotators whose annotations raised the most or least issues. It provides the number of annotations created or updated by the annotators, categorized by those with and without issues. Sort the results in ascending or descending order to arrange annotators systematically and facilitate a clearer examination of their order. Hover over the graph to access details such as:
- The avatar and email ID of the creator
- Total number of annotations
- Total number of issues
- Accuracy and percentage.
