Assignment Analytics Overview
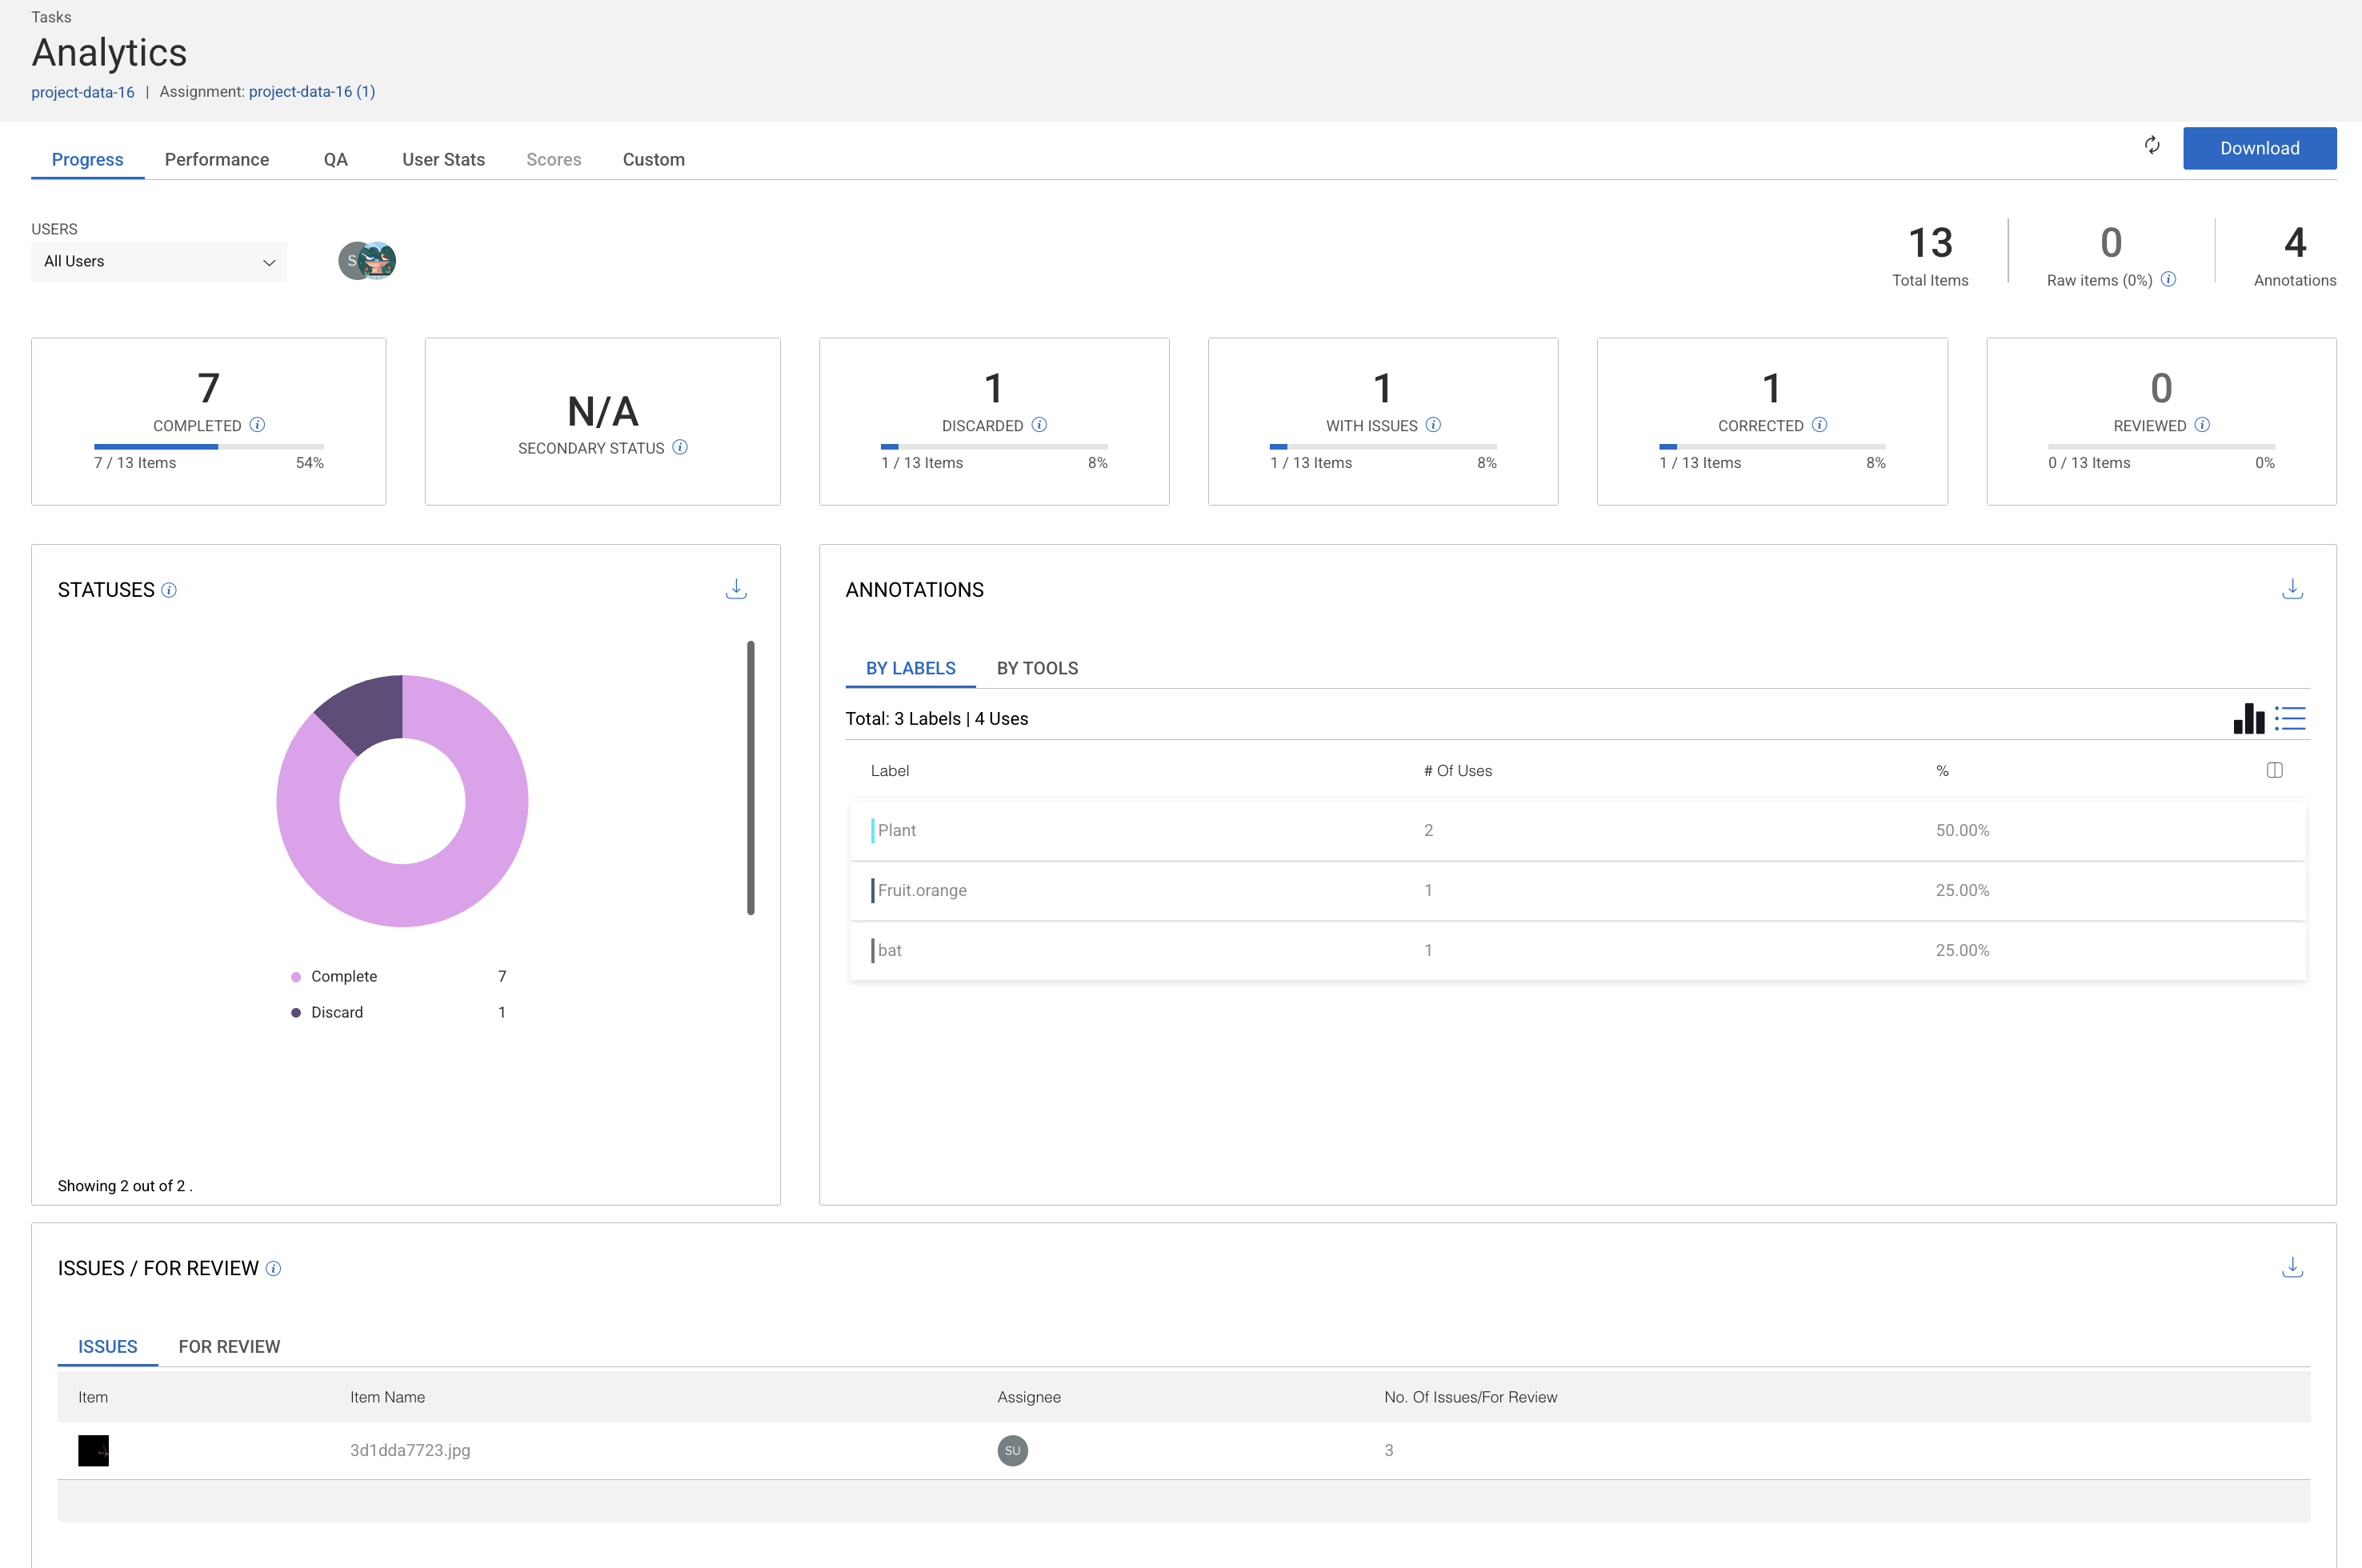
The Assignment Analytics page provides performance and progress insights for a specific assignment. It helps project managers monitor item completion, annotation activity, review status, and quality issues at the assignment level. Also, it allows you to analyze data across Progress, Performance, QA, User Stats, and Scores. The example below shows the Progress view of an assignment. You can explore similar insights in the other tabs. Learn more about Analytics here.
Why These Metrics Matter
Task analytics help you:
Monitor individual assignment progress
Identify quality or review bottlenecks
Analyze annotation distribution
Track annotator performance
Make allocation adjustments if needed
High-Level Metrics (Top Summary)
These metrics give a quick snapshot of the task status:
Total Items: The total number of items included in this assignment.
Raw Items (%): The percentage of items that remain untouched or unprocessed.
Annotations: The total number of annotations created within this assignment.
Item Status Metrics
These counters break down the current state of items in the task:
Completed: Number of items successfully completed by annotators.
Secondary Status: Displays additional status information if secondary workflows are enabled.
Discarded: Number of items removed from the workflow due to irrelevance or quality issues.
With Issues: Number of items that have reported issues associated with them.
Corrected: Number of items that were modified or fixed during review or QA.
Reviewed: Number of items that have passed the QA or review process.
Each metric includes both a count and a percentage relative to the total number of items.
Status Distribution Graph
This chart visualizes how items are distributed across different statuses, such as:
Complete
Discarded
It provides a fast way to assess overall task health and identify bottlenecks.
Annotation Metrics
Annotations by Labels
This table and bar chart show how annotations are distributed by label:
Label name
Number of uses
Percentage of total annotations
This helps identify:
Label imbalance
Overused or underused labels
Annotation trends within the task
Annotations by Tools
This view groups annotations by the annotation tools used (for example, bounding box, polygon, or classification), helping teams understand how data is being annotated.
User Filter
You can filter analytics by user to:
View individual annotator contributions
Compare performance across users
Identify training or quality gaps
Issues / For Review Section
This table lists items within the assignment that:
Have reported issues
Are marked for review
It includes:
Item thumbnail
Item name
Assignee
Number of issues or review flags
This section allows managers to:
Identify problematic items
Follow up with annotators
Track review workload