Overview
Data clustering and visualization are essential techniques in data analysis, particularly in understanding complex datasets. Tool like UMAP is widely used for these purposes.
Their incorporation into the DDOE platform can significantly enhance data analysis capabilities, and provide users with powerful tools to uncover insights from their data through an accessible and scalable interface.
The Clustering application takes care of the entire process, from installing a feature extraction model to loading the embeddings and the Tensor Board application.
Feature Vectors
A Feature Vector is a numerical representation of a data item (such as an image, video frame, document, or annotation) that captures its most meaningful characteristics for analysis or model training.
Key Properties
Structured: It's an array or list of numbers where each number represents a feature, i.e., a measurable property of the data.
Model-ready: These vectors are the foundation for ML tasks like classification, clustering, similarity search, etc.
Generated via Extraction: Typically, feature vectors are created by running an embedding model, such as a neural network, on the raw data.
Example Use Cases
An image might be converted into a 512-dimensional vector using a pre-trained vision model.
A labeled audio clip may be transformed into a numerical vector based on frequency and amplitude patterns.
Feature Sets
A Feature Set is a collection of Feature Vectors derived from a dataset. It acts as the input matrix for machine learning tasks and is typically used for:
Training machine learning models
Evaluating model performance
Clustering data items
Similarity-based retrieval or search
Structure:
Rows: Each row is a Feature Vector representing a single data item.
Columns: Each column corresponds to a feature/attribute (e.g., color value, texture score, sentiment score).
Advantages
Unified Interface: Offers a unified interface for performing complex data analysis tasks, including clustering and visualization, without needing to switch between different tools or write custom code.
Enhanced Data Understanding: Users can gain insights into the structure of their data, identify clusters and outliers, and make informed decisions about further data processing or analysis steps.
Scalability and Accessibility:To handle large datasets and make advanced data analysis techniques accessible to users who may not have a deep background in data science, thereby democratizing the use of sophisticated data analysis methods.
Access the Clustering
Get started with advanced clustering features by access the Clustering tab from within the Dataset Browser to explore and manage your data more efficiently.
If your dataset doesn’t have embeddings yet, no problem! Our platform supports the integration of Clip Embeddings, enabling you to initialize and leverage the clustering feature effectively. This addition will help you streamline your data analysis, improving project outcomes.
Add CLIP Embeddings into Your Dataset
Embeddings are crucial in a dataset for several reasons, particularly when dealing with complex or non-numeric data types like text or images. Machine learning algorithms require numerical input, so embeddings transform non-numeric data into a format these algorithms can process.
Embeddings help in transforming complex, high-dimensional data into a lower-dimensional space that machine learning models can understand and work with effectively. They help the model understand semantics, reduce data dimensions for efficiency, maintain context, improve performance and generalization, and enable knowledge transfer from different tasks.
To add CLIP embeddings, if there are no embeddings available for your dataset:
From the Dataset Browser > Clustering tab, click Add CLIP Embeddings. This will spin up a high-memory machine to execute CLIP model for extracting embeddings from all items in the dataset.
Deleting Datasets
If you delete a dataset that has embeddings extracted using the clustering tab, the embeddings features will also be deleted.
Data Filters
In TensorBoard's Embeddings Projector, there are many filter options that you can use to modify and enhance your data visualization experience. Here's an explanation of the filter options you mentioned:
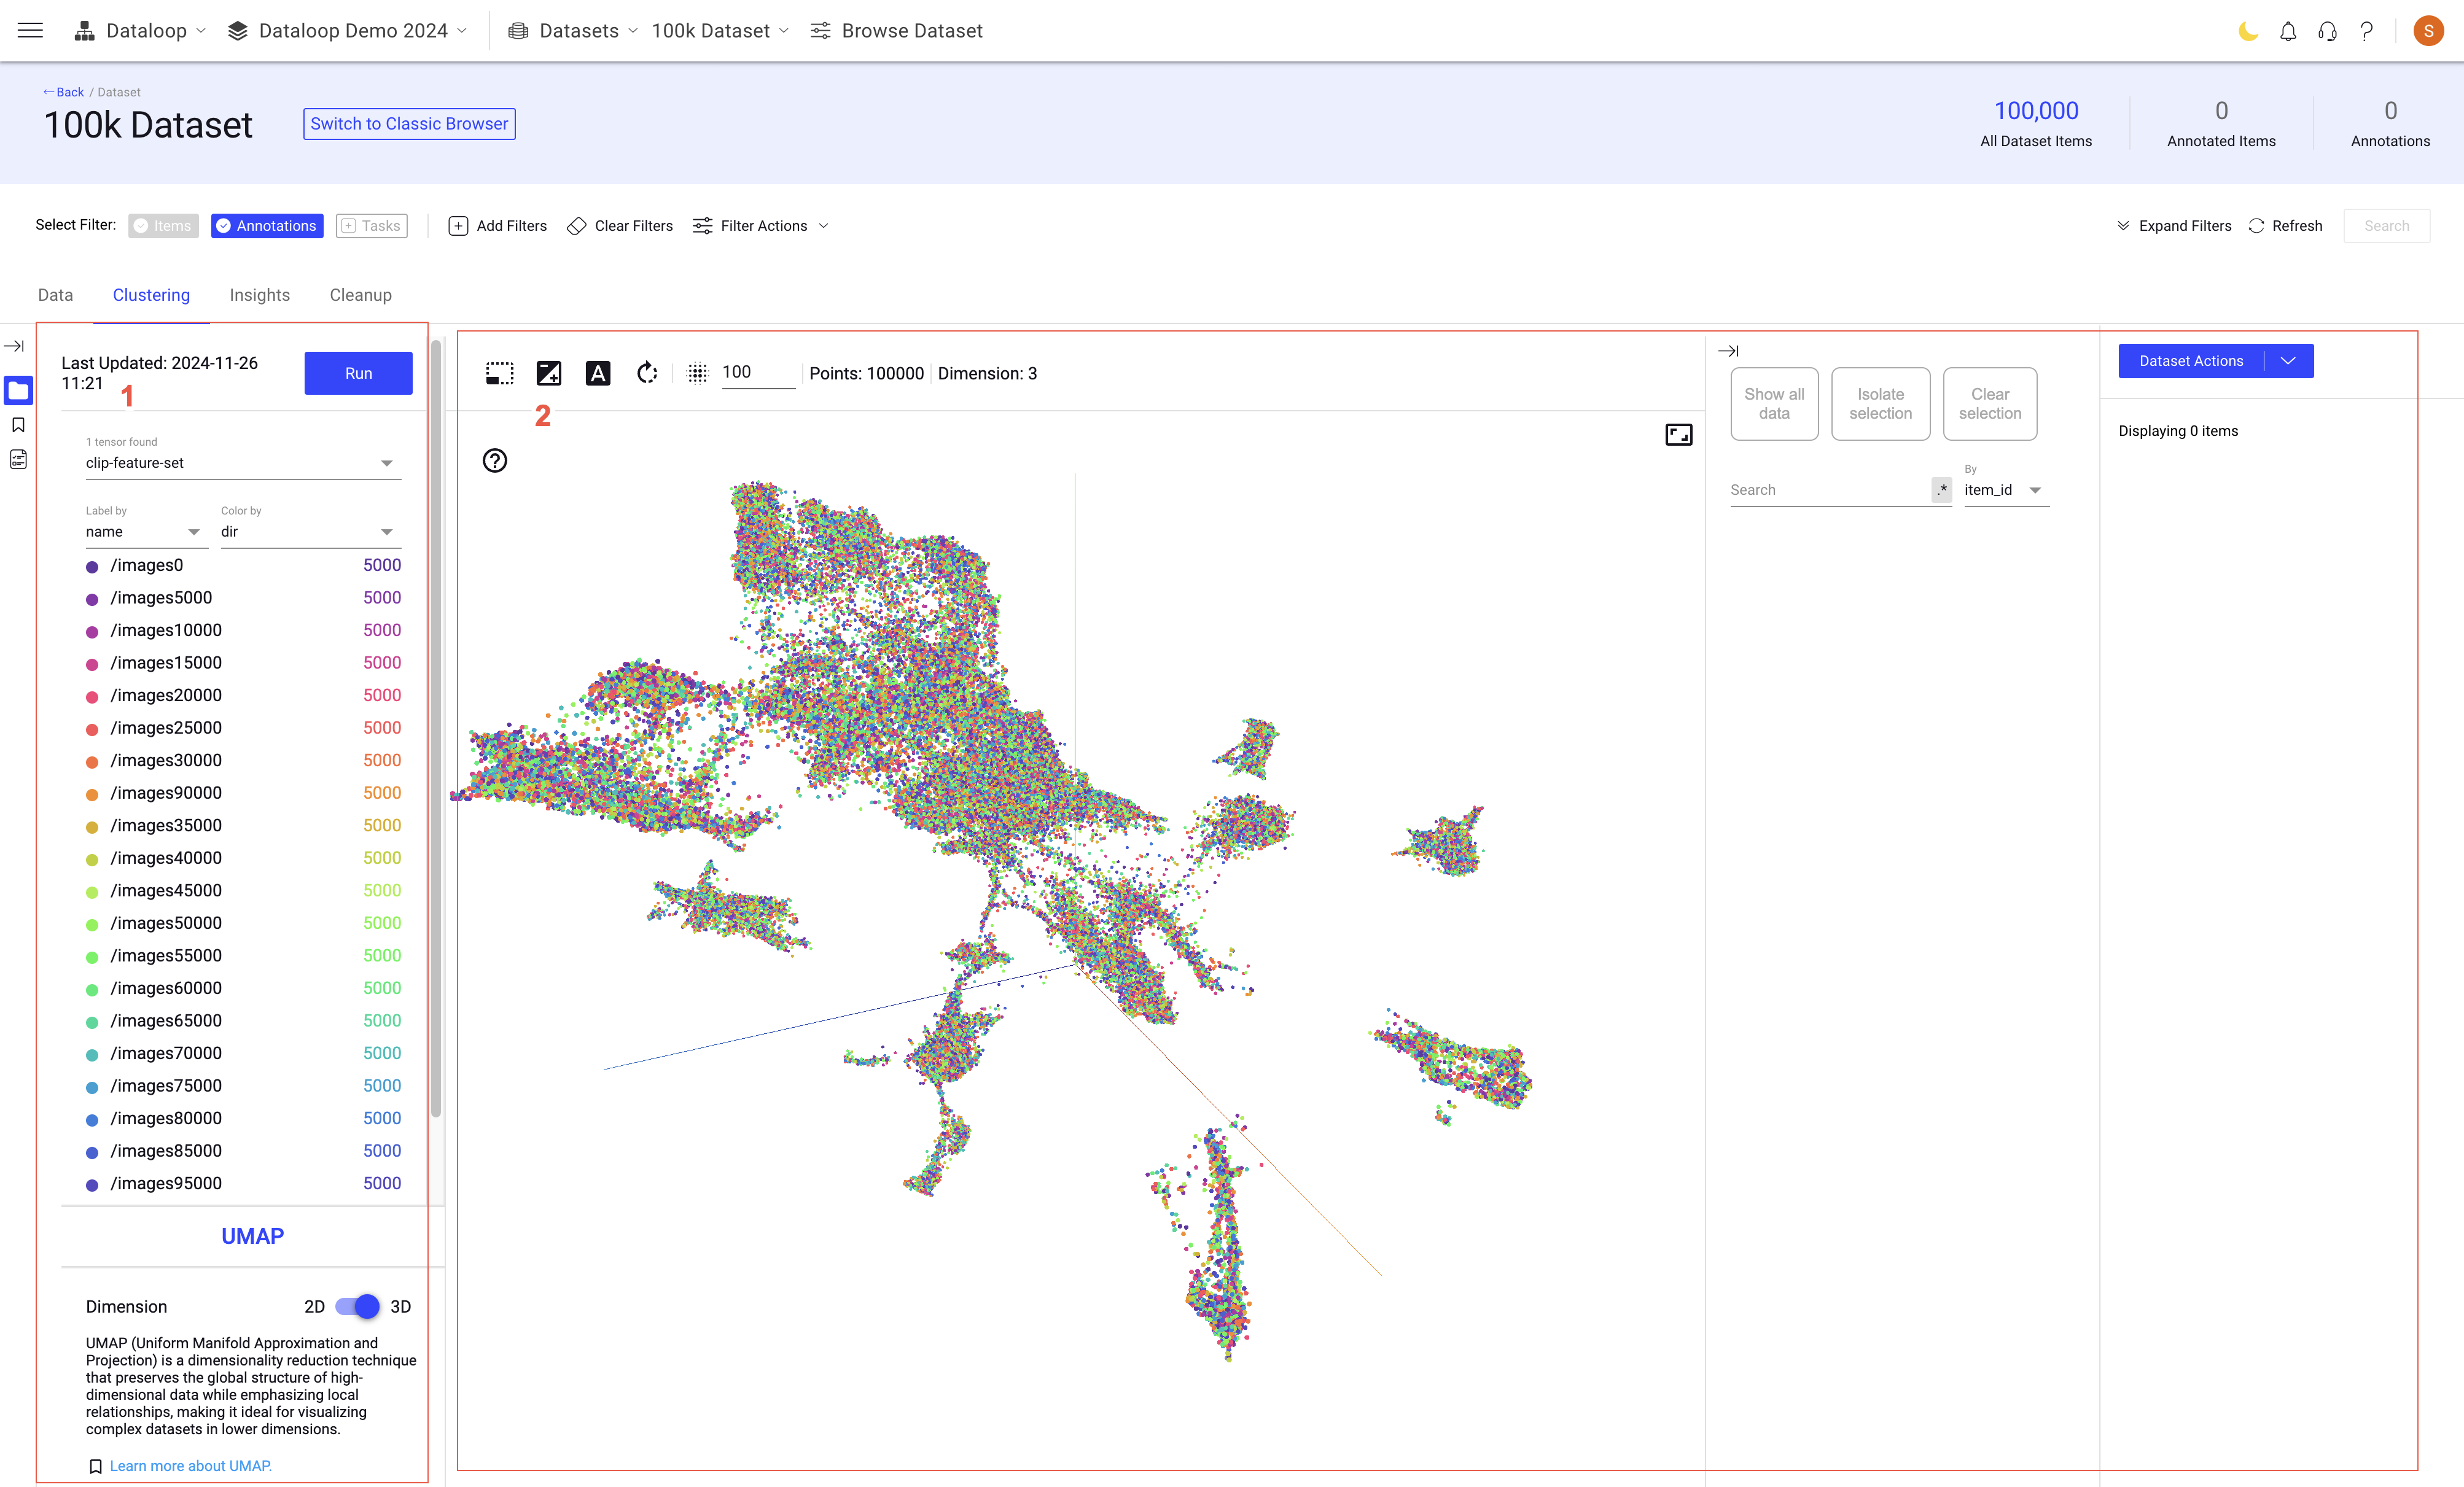
.png)
Run: The timestamp of the last dataset run update is displayed. Click Run to re-generate the embeddings for your dataset.
Tensor - clip-feature-set: Allows selection of specific features from a high-dimensional dataset for focused analysis.
Label by: Allows you to label the data points by the
item ID,folder name,item name, etc. When selected, the labels of the data points displays accordingly.Color by: Allows you to color the data points by
is_annotated,label,dir, andannotations_count.Color by Metadata: Allows you to color the data points using the Metadata parameters. Click on the Add Metadata field, and select a metadata to apply.
Spherize data: Spherizing data in clustering involves standardizing each feature to have a mean of zero and a standard deviation of one, ensuring equal contribution of each feature to the distance calculations used in clustering algorithms.
Visualization type: Offers UMAP (Uniform Manifold Approximation and Projection) method to visualize data.
Color Datapoints by Metadata
Clustering feature allows you to color the data points using the Metadata parameters.
Open the Dataset Browser → Clustring tab, click on the Add Metadata field. An Add Metadata popup is displayed.
Select a metadata value from the list.
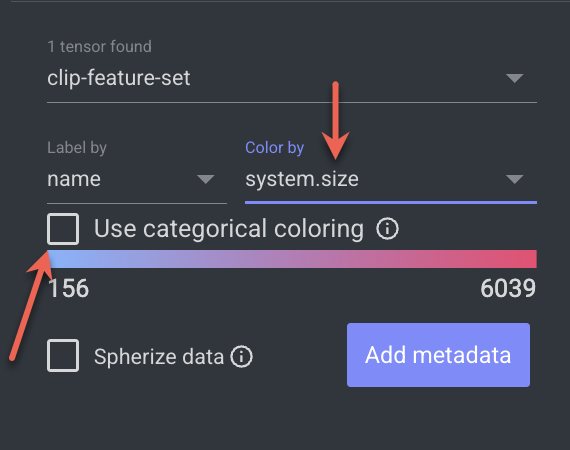
Click Add Metadata Field. For example, added
system.size.The newly added metadata field will be selected in the Color By field by default.
For the
system.size, you can click on the checkbox Use Categorical coloring. A size (in bytes) list will be displayed.Click on a size, it highlights the item on the Clustering canvas.
Click on it for more details to be displayed on the right-side panel.
Label By Collections
Clustering feature allows you to label datapoints by their collection name.
.png)
Open the Dataset Browser → Clustring tab, click on the Label By field.
Select the Collection from the list.
Hover-over datapoints will show the Collection names as labels.
Color By Collections
Clustering feature allows you to color datapoints by their collection name.
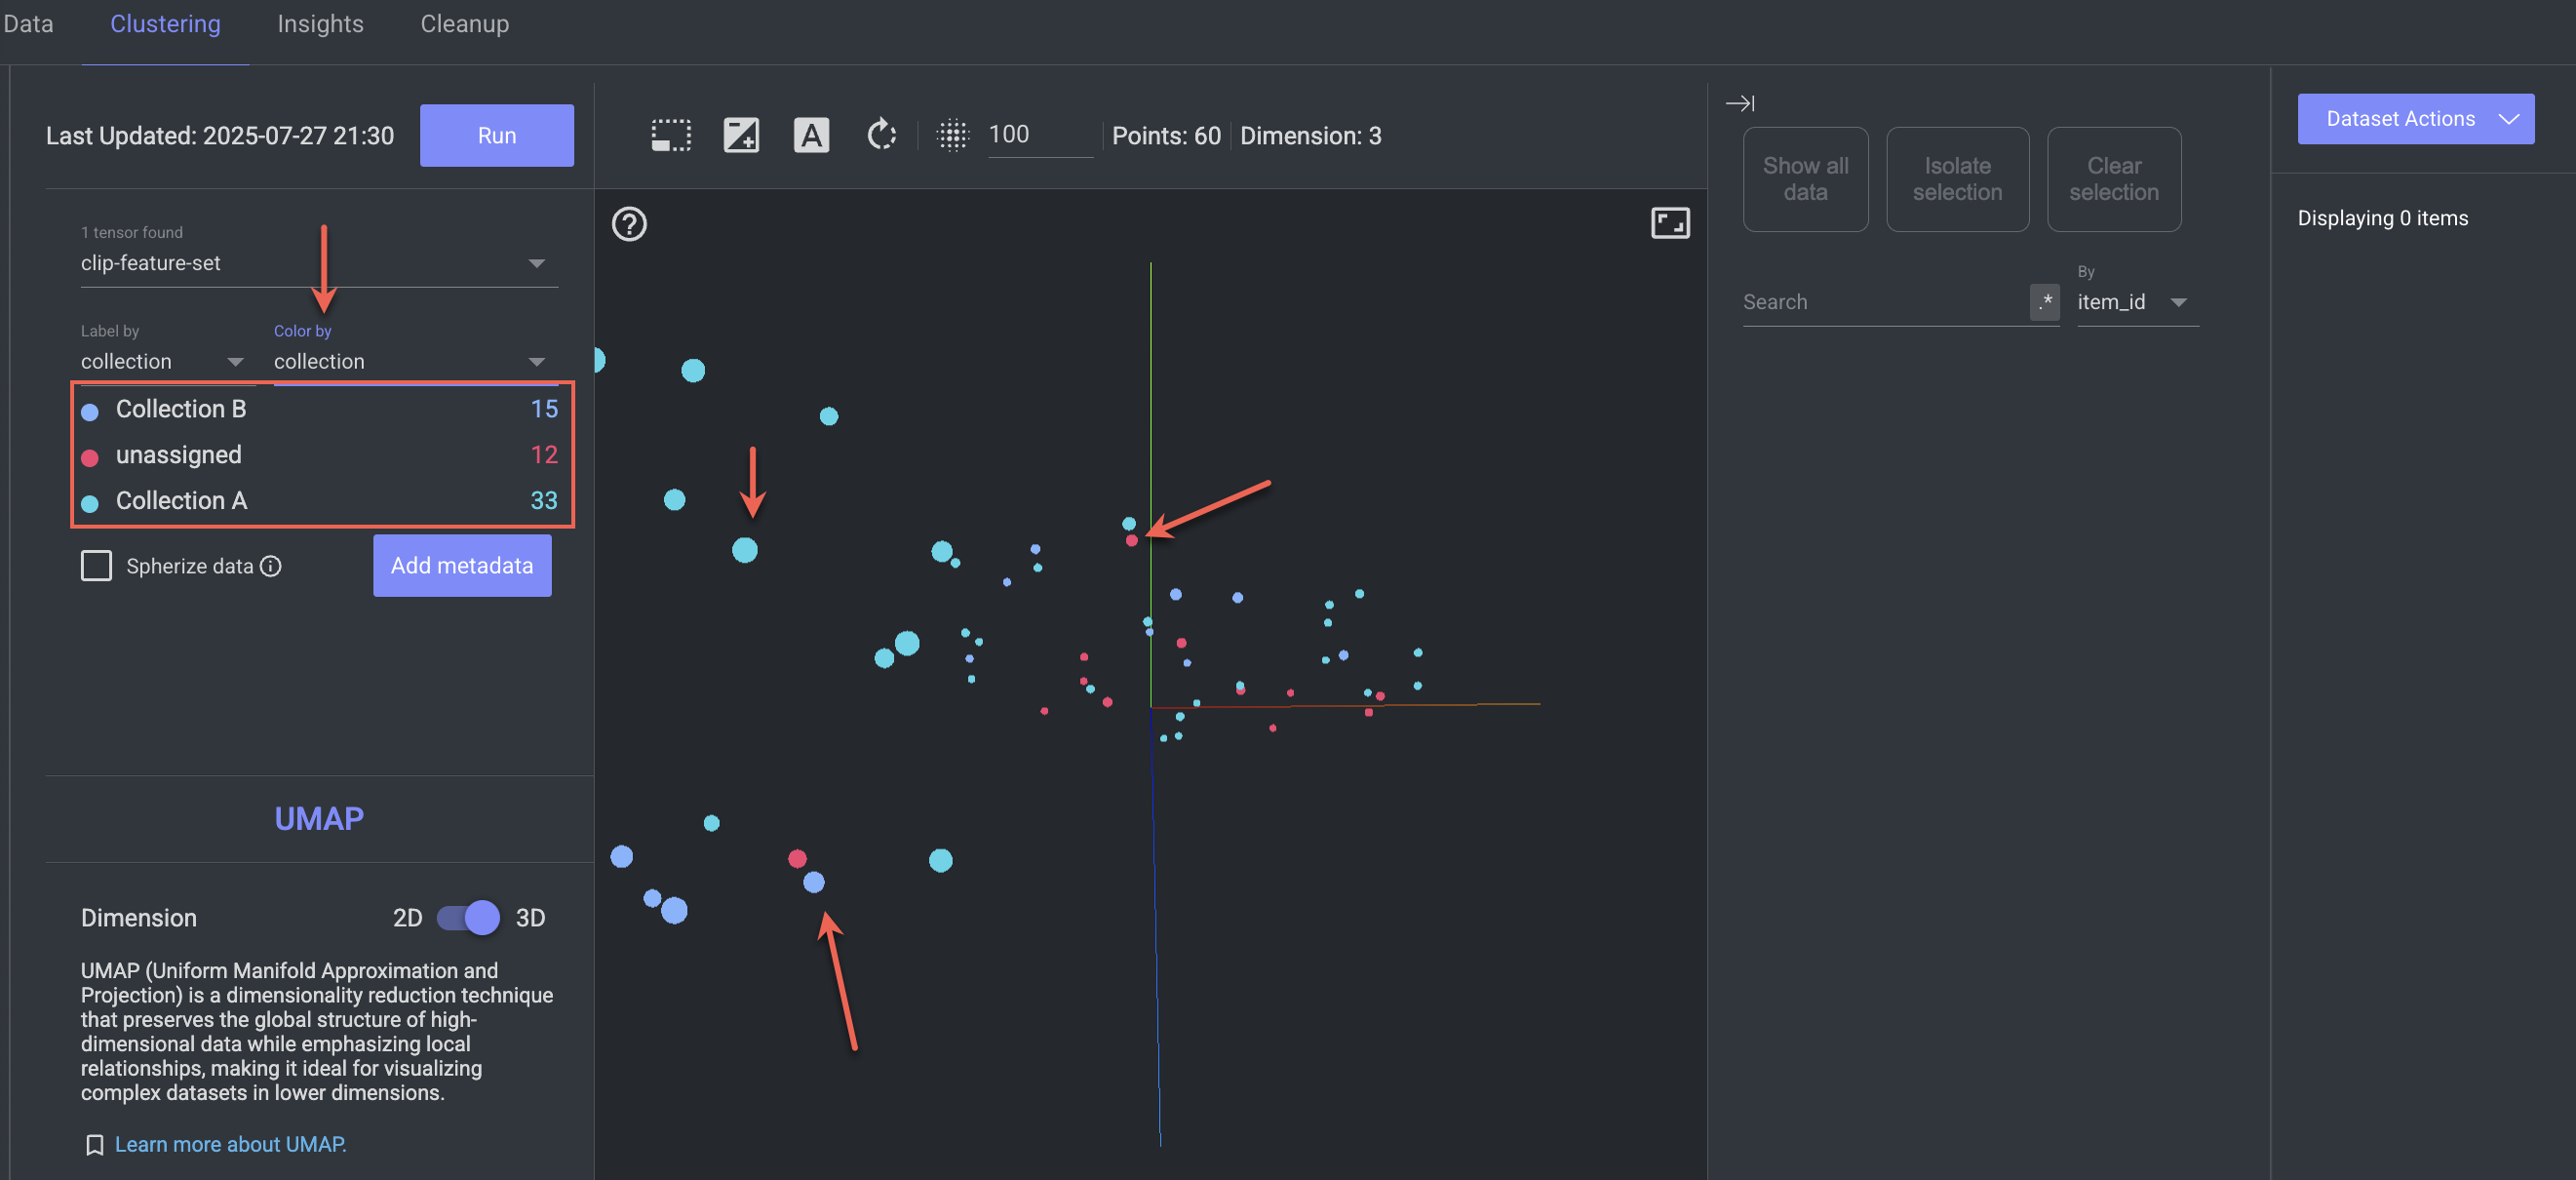
Open the Dataset Browser → Clustring tab, click on the Color By field.
Select the Collection from the list. Upon selection, each point will be color-coded according to its associated collection list, which will also be displayed in the left panel for reference.
Rerun Extraction Process
When there is a mismatch between the number of data items and their Feature Vectors in a data clustering application.
To fix this problem, it's recommended to rerun the extraction on the whole dataset to ensure that all items have feature vectors. This step will help correct any discrepancies, ensuring that the clustering algorithm can accurately group similar items based on complete and correct data.
For example, if JSON files in the dataset lack feature vectors while other item types are included, so you will receive a warning message once the clip extraction is completed.
Warning
For certain feature sets, the number of items does not match the number of feature vectors. Please re-run the extraction process on the entire dataset to ensure consistency.
To rerun the entire dataset, follow instructions:
In the Dataset Browser -> Data tab, click on the Select All. It selects all the items in the dataset.
Click Dataset Actions.
Select the Deployment slot -> Clip Extract Features from the list. The feature extraction process begins, and you can view the status in the Notifications bell icon.
Once the extraction is completed, go to the Clustering tab.
Click Run from the left-side panel to ensure that you have the latest feature vectors.
Feature Set Visualizations
The TensorBoard Embeddings Projector allows for the visualization of high-dimensional embeddings, which are typically represented in lower dimensions using technique UMAP. This feature is particularly useful for clustering, as it enables the visualization of how data points are grouped.
Users can interactively explore these embeddings through operations like zooming, rotating, and panning, and can color-code points based on cluster assignments or other metadata to better understand the distribution and separation of clusters.
Additional functionalities include hovering over points for more information and filtering based on labels or metrics to analyze specific clusters or compare different ones.
The following functions can be performed on the visualization types:
Bounding Box Selection: This feature allows users to draw a rectangular box in the visualization space to select a group of points. It's useful for focusing on and analyzing specific clusters or areas within the dataset.
Edit Current Selection: After selecting a group of points, this function enables users to manage and modify the selection. For example, users can remove certain points from the selection or add more points by adjusting the criteria or modifying the boundary of the selection.
Enable or Disable 3D labels Mode: This toggles the visibility of labels on the points in the 3D visualization. Enabling it helps in identifying specific data points by their labels, while disabling it can declutter the view if the visualization becomes too crowded.
Invert the Current Selection: It allows you to reverse the active selection within the data cluster. This is particularly useful when you want to quickly select all unselected items in a cluster while deselecting the currently selected one.
Auto-select the Diverse Points: It helps streamline data selection by automatically choosing a diverse subset of points from your dataset. The selection is based on the number of clusters and your current selection, balancing diversity and relevance.
Points: This typically refers to the actual data points being visualized. Users can interact with these points to view more detailed information or to track how individual data points relate to the rest of the dataset.
Dimension: It shows the number of dimensions available in the feature vector.
Reset Zoom to fit all points: Resets the zoom level so all points in the dataset fit into the visible area of the projector. This is useful for getting a broad overview of the data distribution after zooming in or out.
Show all data: Ensures that all data points are visible in the visualization, potentially by adjusting the plot boundaries or scale. This is useful for recentering the view if you've navigated away from some data points.
Isolate selection: This function focuses on a selected subset of data points, hiding all other points. It's particularly useful for closely examining the characteristics of a specific group of points without other data points distracting from the analysis.
Clear selection: Clears any selections made, either through bounding box or individual point selection. This resets the view to include all data points without any specific focus.
Search field: Allows users to search for specific points based on their metadata. For example, one could search for points with specific labels or identifiers, which is handy for quickly locating specific instances or groups within the dataset.
Filter by: Allows to filter items by item iD, directory (location), name, thumbnail, annotation status, label name, annotations count, etc.
Dataset Actions: This generally refers to a set of actions related to the dataset as a whole.
Visualizations Tool - UMAP
Purpose: UMAP (Uniform Manifold Approximation and Projection) is used for dimensionality reduction and is particularly good at preserving both local and global data structure. It's useful for clustering because it helps reveal the intrinsic structure of the data.
Visualization: UMAP can project high-dimensional data into a lower-dimensional space (usually 2D or 3D), making it easier to visualize clusters and patterns that wouldn't be apparent in the original high-dimensional space.
Use Cases:
Clustering Analysis: Visualizing high-dimensional data to identify natural clusters.
Anomaly Detection: Highlighting outliers in datasets, such as in fraud detection.
Genomics: Understanding genetic variation and relationships in large genomic datasets.
Image Analysis: Visualizing feature spaces in computer vision to understand image similarities.
Neighbors and MinDist
These two key parameters significantly influence how the algorithm works and the resulting visualizations: neighbors (often referred to as n_neighbors) and MinDist (minimum distance, typically referred to as min_dist). Understanding these parameters is crucial for effectively using UMAP for dimensionality reduction and data visualization.
Neighbors (n_neighbors)
This parameter controls how UMAP balances local versus global structure in the data. It represents the number of neighboring points each point is considered to be connected to.
A larger n_neighbors value encourages UMAP to capture more of the global structure, making the visualization reflect broader data relationships but potentially underemphasizing smaller clusters or local patterns.
A smaller n_neighbors value makes UMAP focus on local structure, which can highlight smaller clusters and finer details in the data but may lose sight of the overall data configuration.
MinDist (min_dist)
This parameter sets the minimum distance between points in the low-dimensional space. Essentially, it controls how tightly UMAP is allowed to pack points together.
A larger min_dist value forces points to spread out more in the visualization, which can help in seeing the separation between clusters, but might also disperse points within a cluster too much.
A smaller min_dist value allows points to cluster more tightly, producing denser clusters. This is useful for identifying intricate structures within clusters but can sometimes lead to overlapping clusters if too small.
More Clustering Options
There are many actions that you can perform in the Clustering applications. In the right-side panel, click on the Dataset Actions and perform the required actions.
Refresh the Data
To enhance performance, the Clustering tab data is not automatically refreshed. To update the Clustering tab:
Go to the Data page from the left-side menu.
Click on the dataset from the dataset list.
Select the Clustering tab.
Click on the Run to refresh the data in the dataset. You can view the timestamp of the last update.