DDOE enables you to create pipelines either from scratch or using a template. You can choose from your organization's templates, DDOE’s marketplace templates, or build one entirely on your own, providing both flexibility and efficiency in developing and deploying data processing and machine learning workflows.
This article guides you through creating pipelines on the DDOE platform.
Using Pipeline Templates
Create Pipeline Using Templates: The Marketplace is a comprehensive repository that contains a wide variety of pre-defined pipeline templates. These templates are designed to cover common use cases and scenarios across different industries and applications, providing a quick and efficient way to get started with pipeline creation. Here’s how it works:
Open the Pipelines page from the left-side menu.

Click Create Pipeline and select the Use a Template from the list. It opens the Select Pipeline Template popup window.

Select a template from the list.
Click Create Pipeline. The selected pipeline template will be displayed, and you can configure the available nodes as needed.
Create Your Pipeline
Creating pipelines from scratch is an approach suited for users with specific requirements that cannot be fully met by existing templates, or for those who prefer to have complete control over every aspect of their pipeline design. Here’s how it works:
Creating a pipeline in the DDOE platform and activating it involves many steps, such as:
1. Create Your Pipeline
Open the Pipelines page from the left-side menu.

Click Create Pipeline and select the Start from Scratch from the list. It opens the Set Pipeline Name popup window.

Enter a name for the new pipeline.
Click Create Pipeline. The Pipeline window is displayed, and you can configure the available nodes as needed.
2. Add Pipeline Nodes
Your Pipeline Canvas
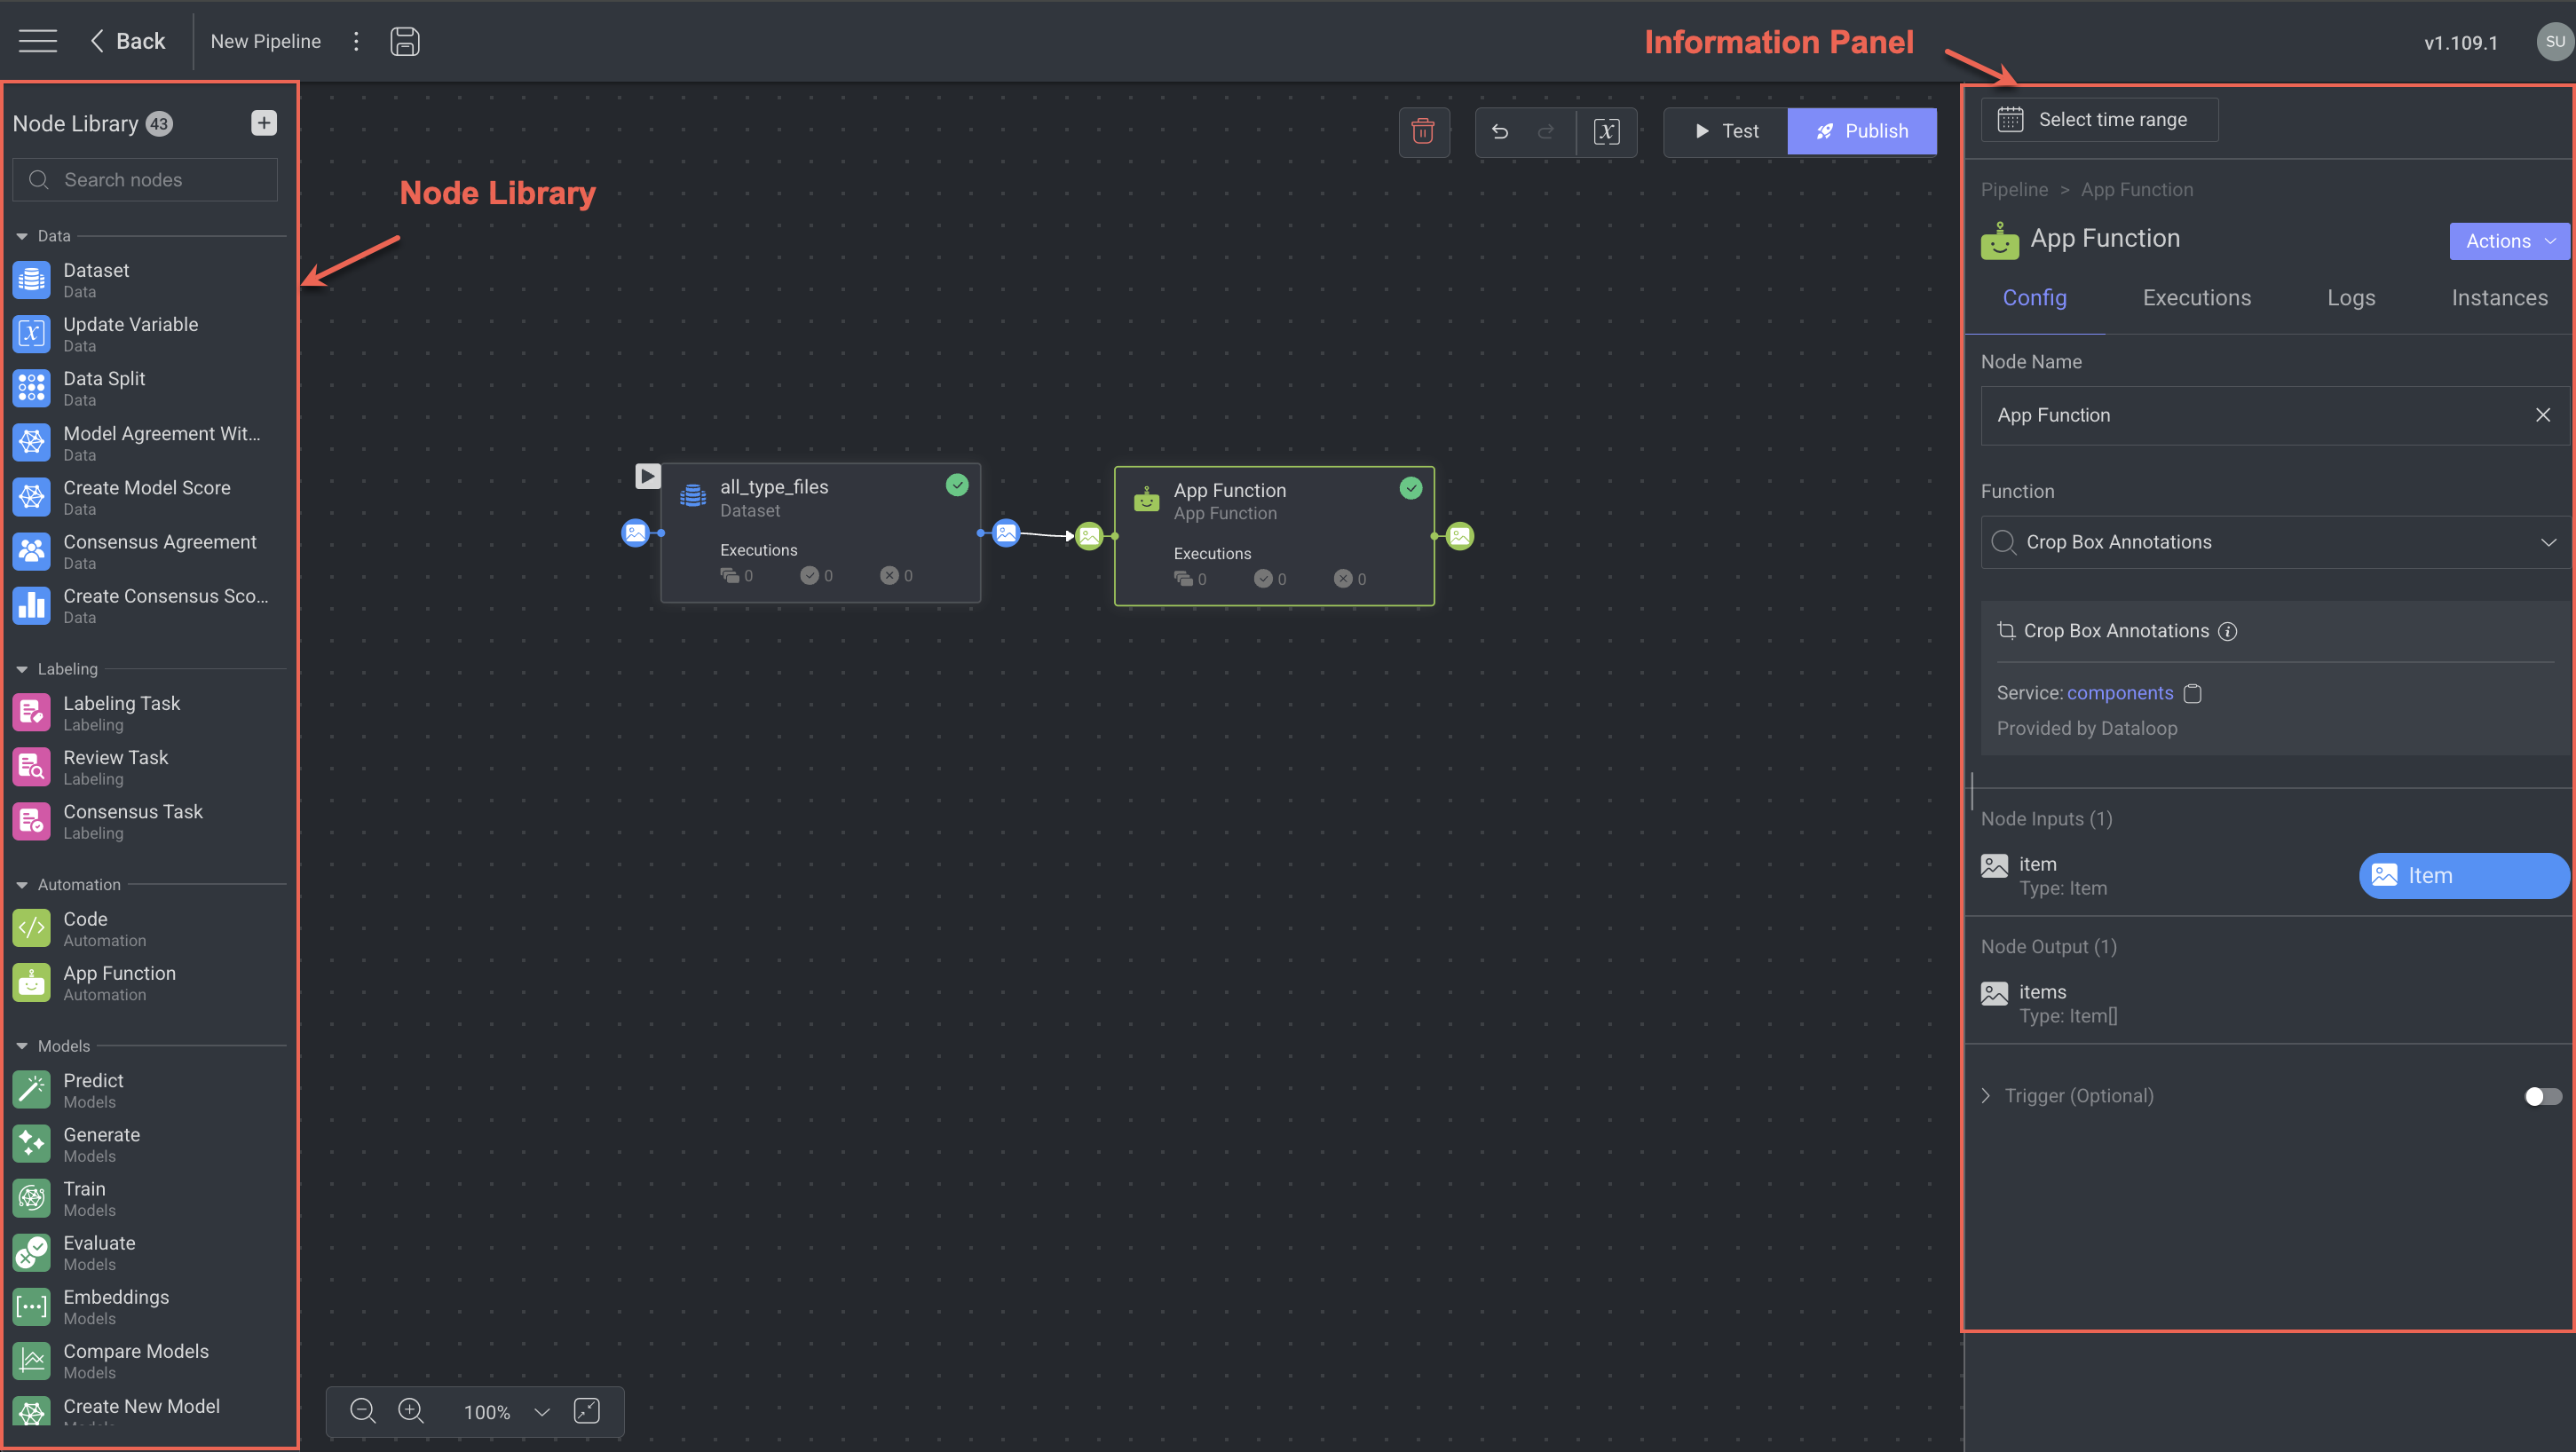
Node Library:
Information Panel:
To compose a pipeline, drag and drop nodes onto the canvas and connect them by dragging the output port of one node to the input port of the next node.
Clicking on a node output port and releasing it will create an instant connection with the closest input port available.
Canvas Navigation
Left-click and hold on to any node to be able to drag it around the canvas.
Right-click and hold on to the canvas to be able to drag the entire canvas.
.png)
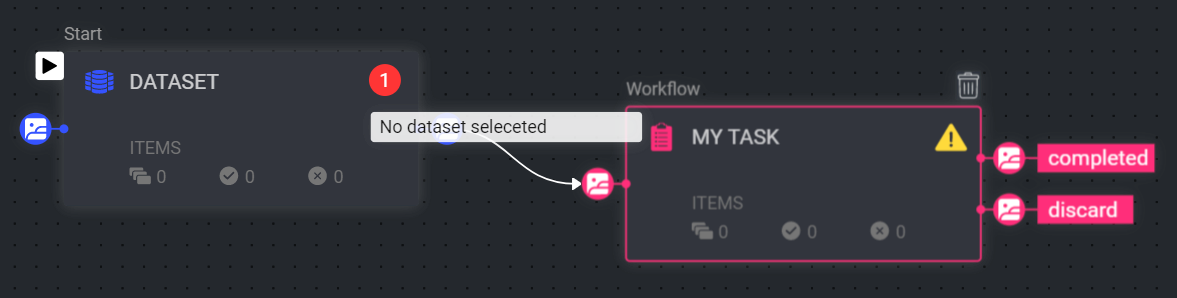
3. Verify the Starting Node
The starting icon  will appear next to the first node you place on the canvas. This icon can be dragged and placed on any node to mark it as the starting point of the pipeline.
When triggering data into a pipeline (for example, from the dataset-browser), the data enters the pipeline at the node set with the starting point.
4. Configure the Nodes
Configure the node inputs such as Fixed Value or Variables, Set Functions, Create Labeling Tasks, and Set Triggering Data in nodes, etc.
Refer to the following node category list and configure the nodes according to the type:
Learn more about the Node Inputs
Learn more about the Triggering Data
5. Save the Pipeline
Click on the Save icon to save your updates.
6. Test Your Pipeline
Read here to learn how to test your pipeline.
7. Activate the Pipeline
To activate your pipeline, click Publish in the pipeline page or the play button from the project's Pipeline page.
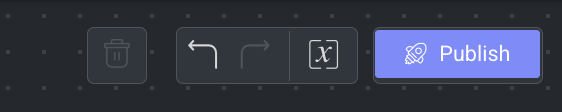
If you are unable to click Publish, or that the installation process has failed, it might be due to configuration issues of your pipeline nodes or errors in the pipeline composition:
To monitor node configuration issues, hover over the warning/errors icons on the nodes to see what issues need to be resolved. Resolve the issue, and the warning/error icon should disappear.
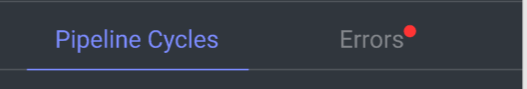
To monitor installation errors, click on the Error tab in the pipeline’s information panel on the right and check the error messages.
8. Trigger the Pipeline
Once you start the pipeline, you can trigger the pipeline by invoking data to pipeline by using Automatic, Manual, and via SDK invocation.
Create Custom Applications
DDOE allows you to create custom node applications using your external docker images.
Create a Pipeline
Open the Pipelines page from the left-side menu.
Click Create Pipeline and select the Start from Scratch from the list. It opens the Set Pipeline Name popup window.
Enter a name for the new pipeline.
Click Create Pipeline. The Pipeline window is displayed, and you can configure the available nodes as needed.
Place the Nodes
Select the starting nodes from the Node Library and drag them to the Canvas.
Add a Code node in the canvas and make the required updates.
Complete the connections.
Learn more about the pipeline nodes.
Customize the Code Node Using Your Docker Image
Prerequisites
To integrate your customized private container registry, you must create container registry integrations and secrets.
Learn how to Add Integrations
Learn how to Add Secrets
Learn how to Integrate Container Registries
Select the Code node and click Actions.
Select Edit Service Settings from the list.
Add Secrets and Integrations if your docker image is private. Ignore, if public.
Click Edit Configuration.
In the Docker Image field, enter your docker image URL.
Complete the remaining steps, if required.
Activate / Publish the Pipeline
To activate your pipeline, click Publish in the pipeline editor screen or the play button from the project's Pipeline page.
Create Model Applications
DDOE allows the installations for AI/ML models by allowing them to be hosted and executed on:
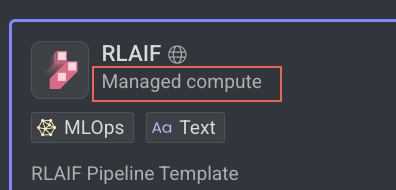
DDOE's Managed Compute (internal infrastructure): The Models run on the DDOE's Compute.
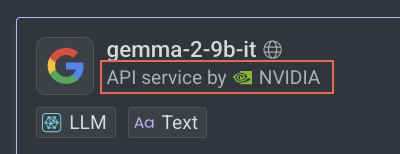
External Compute Providers (e.g., OpenAI, Azure, GCP, IBM, NVIDIA) via API Service Integration: The Models run on external provider's compute, and which requires secret credentials to complete the installation.
Create a Pipeline
Open the Pipelines page from the left-side menu.
Click Create Pipeline and select the Start from Scratch from the list. It opens the Set Pipeline Name popup window.
Enter a name for the new pipeline.
Click Create Pipeline. The Pipeline window is displayed, and you can configure the available nodes as needed.
Place the Nodes
DDOE allows you to install Models and Applications running on DDOE Compute and External Compute Providers (e.g., OpenAI, Azure, GCP, IBM, NVIDIA) via API Service Integration.
Select the required nodes (except model application) from the Node Library and drag them to the Canvas.
Click on the + icon next to the Node Library.
Select a model / application from the Models / Applications tab and click Add Node.
Select the model variations / application function from the list:
If the model / application is running on an external compute, click Proceed.
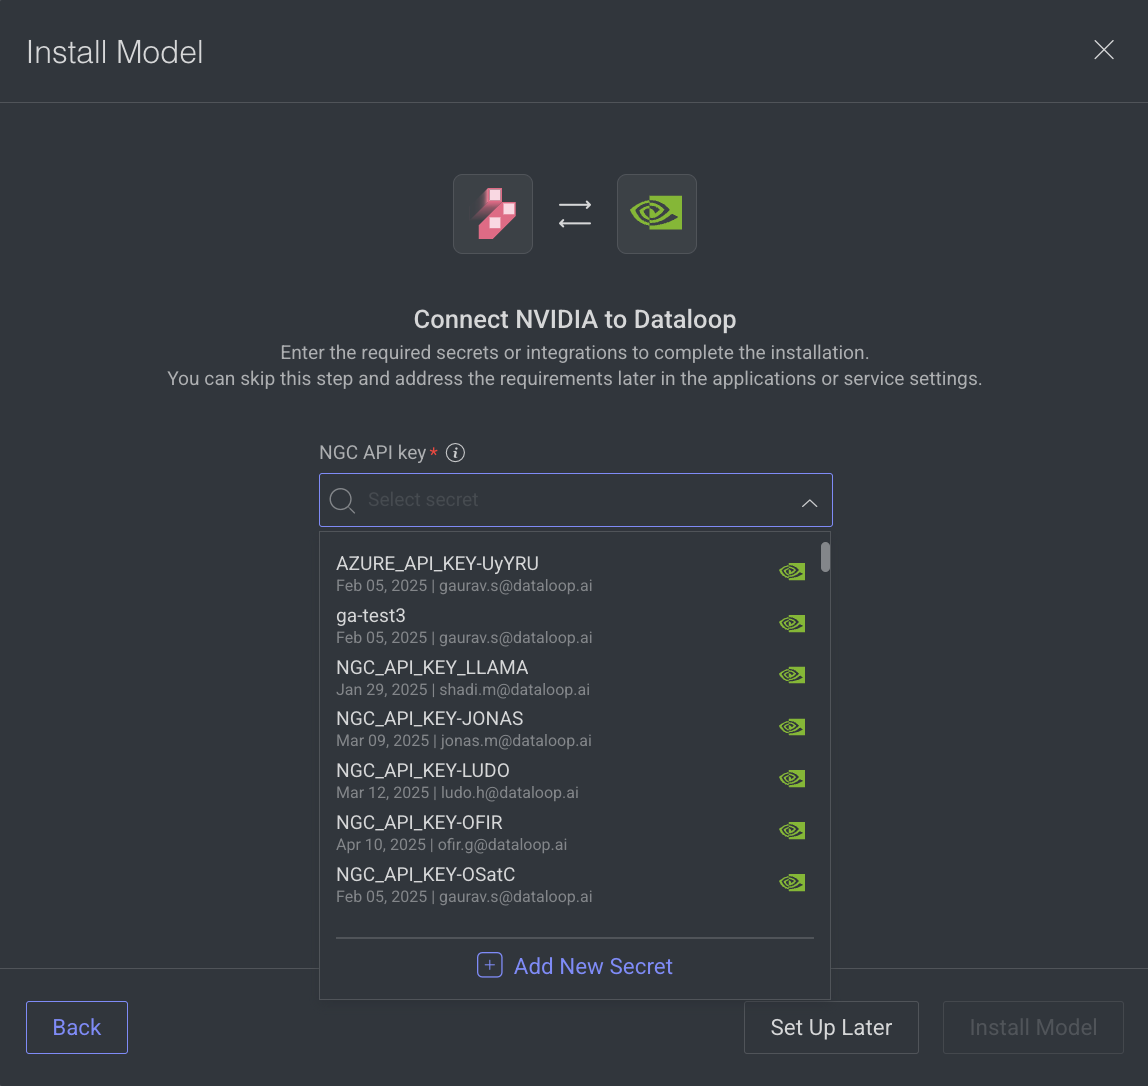
Select an API Key, Secret or an Integration, as required. If not available,
If there is no secret, click Add New Secret and follow the steps.
To set the integration later, click Set Up Later.
Click Install Model / Install Application
Else, click Install Model / Install Application pop-up window is displayed, click Install Model / Install Application. Click on the View Model to view it under the Model Management → Versions tab.
Go back to the Pipeline and view the newly added node under the Models' category in the left-side node library.
Drag it to the canvas and make the required configurations.
Complete the connections.
Learn more about the pipeline nodes.
Activate / Publish the Pipeline
To activate your pipeline, click Publish or the play button from the project's Pipeline page.
Testing Your Pipeline
The Test Mode feature in DDOE lets you run and validate a pipeline while it is still in edit mode, before you install or deploy it. This helps you ensure that configurations, inputs, and outputs are correct, reducing errors during production runs.
Testing a pipeline before deployment allows you to:
Validate pipeline configuration and connections.
Check that all input types (datasets, models, JSON, tasks, etc.) are set correctly.
Confirm that the pipeline produces the expected results.
Provide annotators and developers with a safe environment for trial runs without affecting live projects.
Identify errors early and prevent invalid deployments.
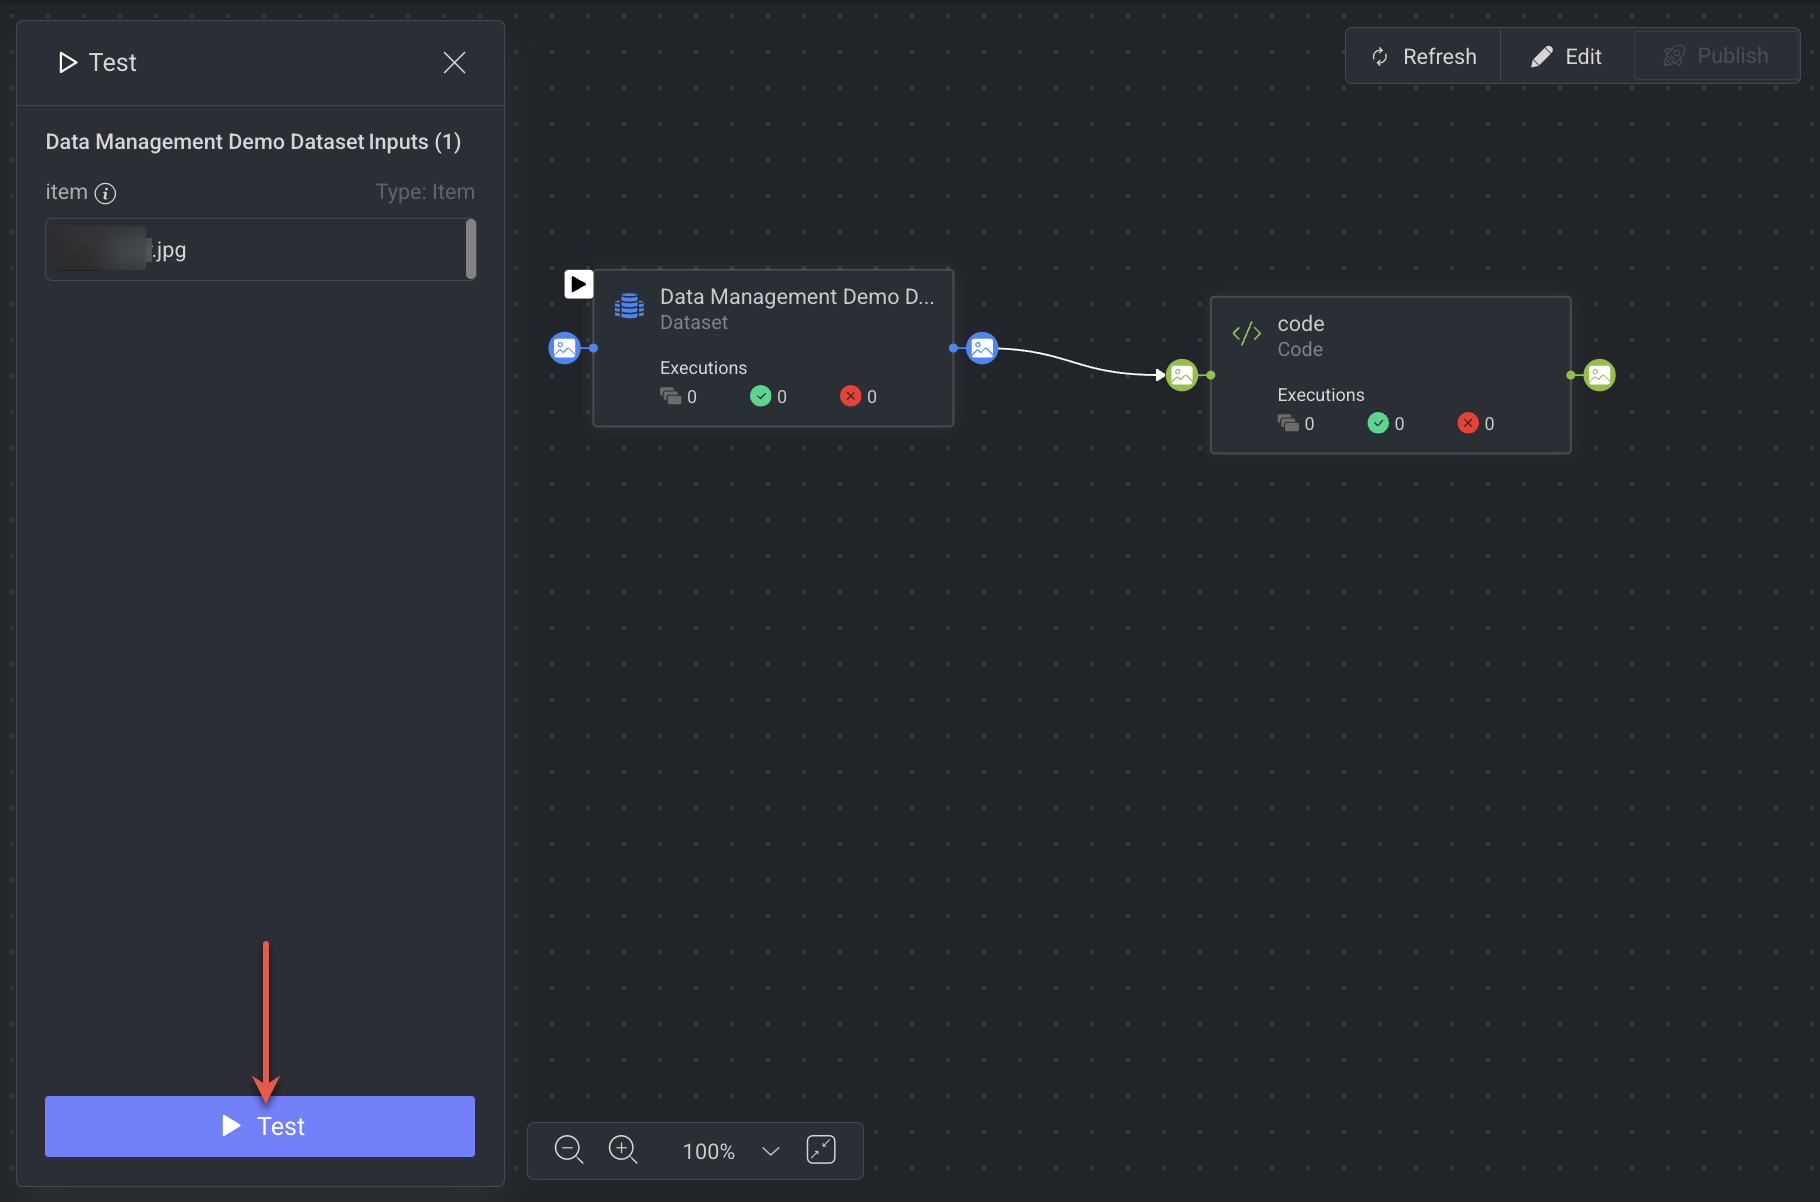
1. Open Test Mode
Go to the Pipeline Editor.
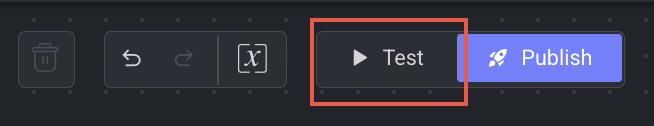
Click the Test button in the toolbar. The button is only enabled when the pipeline configuration is valid.
Once clicked, a Test Panel will open on the left-side of the screen.
2. Provide Test Inputs
The system will automatically list all the required inputs for the start node.
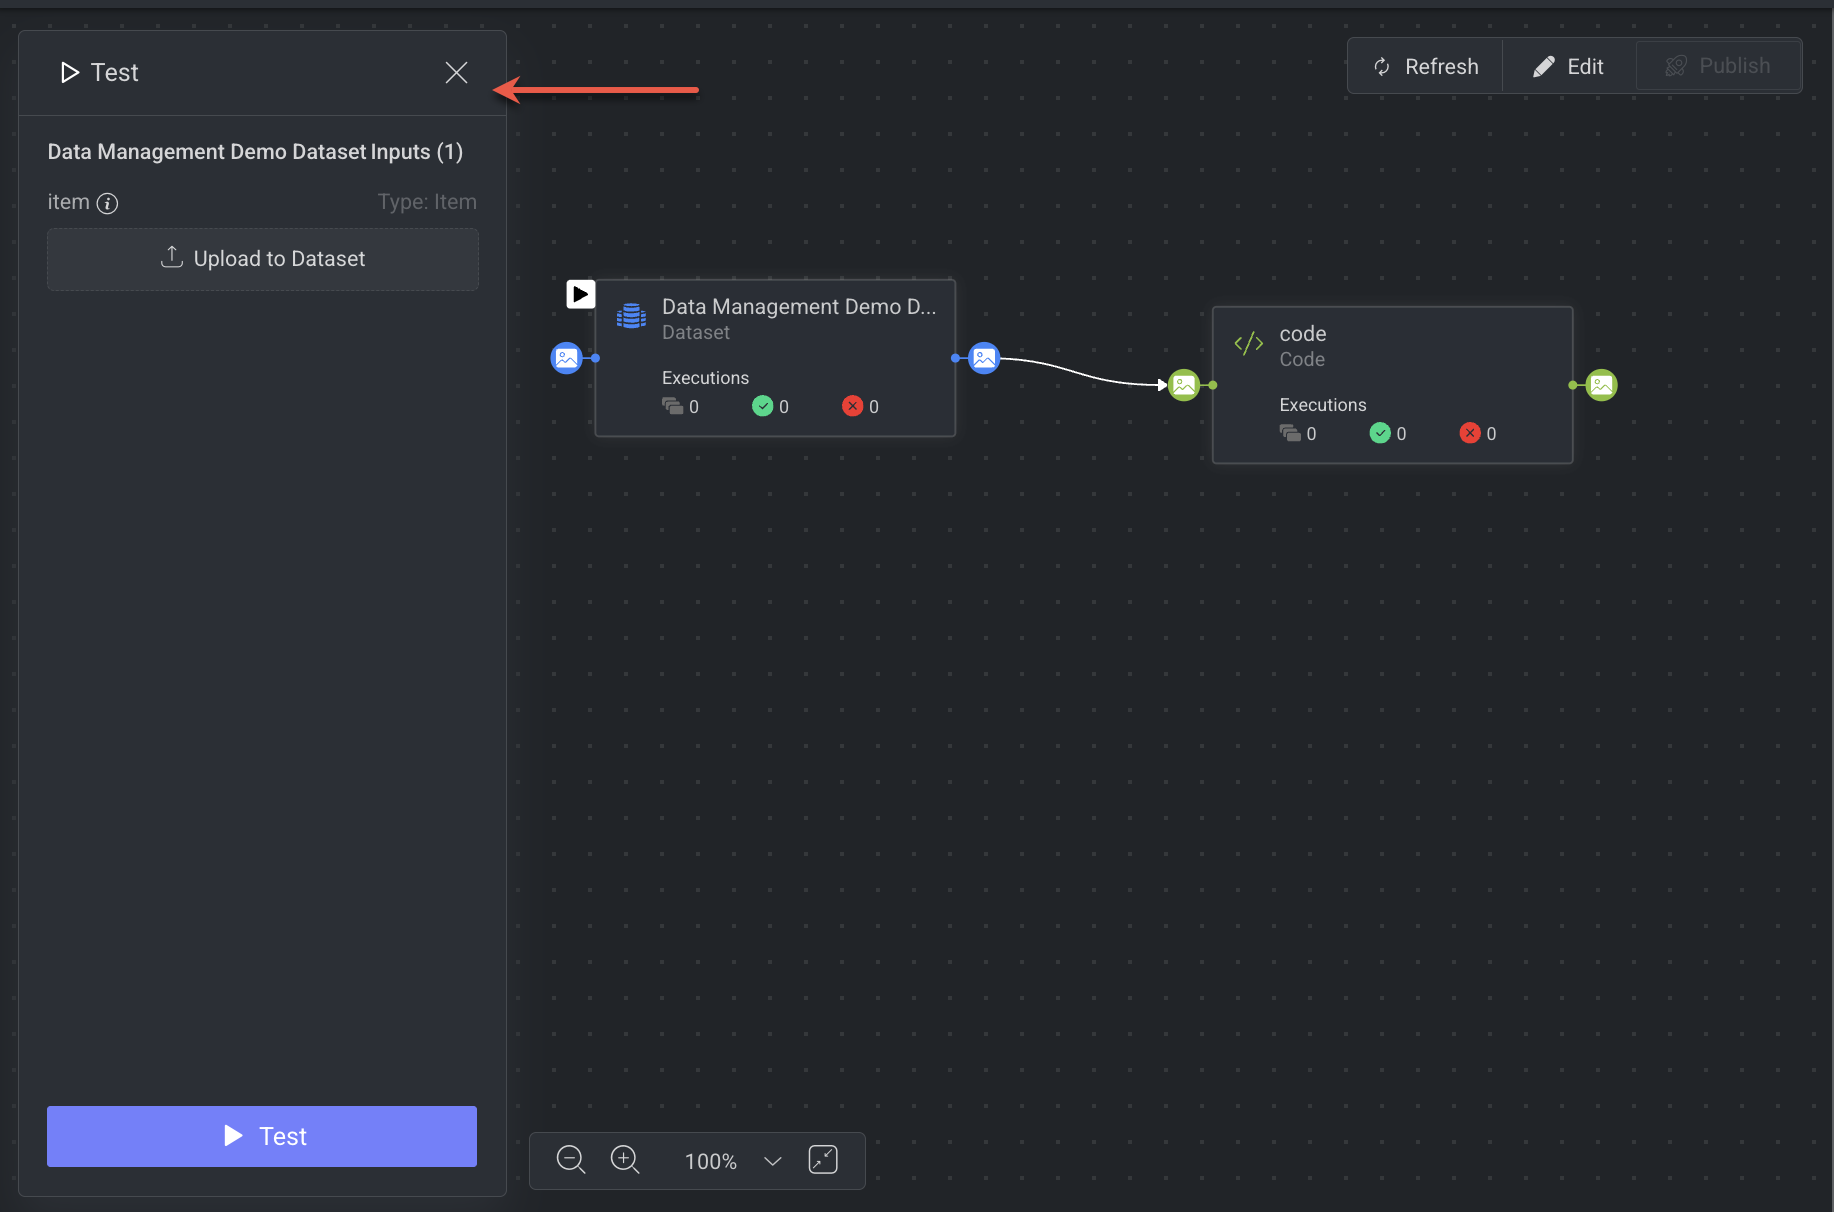
If an input parameter already has a fixed value or variable, it will be pre-selected in the Test Panel.
You can override or update these values before running the test.
Input Types:
Models / Datasets
Dropdown selectors list all available models and datasets.
Models: All models are shown (any status), unlike the Predict Node which may filter them.
Datasets: Uses the same selector as the Dataset Node.
Other Entities (task, execution, service, assignment, package, project, etc.)
Displayed as text input fields. For example, “Insert value (Task ID)”
JSON Inputs
Shown in a small inline editor.
Can be expanded to a larger editor for convenience.
An empty
{}is considered valid.
Item Input (File Upload)
Allows uploading a file to test item-based pipelines.
Requires selecting a dataset (mandatory) and optionally a folder.
If the start node is a Dataset Node or Task Node, the dataset/folder will be preselected.
3. Validate Inputs
Before running the test, the system validates all provided inputs:
All inputs are mandatory. Missing values trigger validation errors.
Incorrect values also generate validation errors.
For JSON inputs,
{}is sufficient to pass validation.
4. Run the Test
After successful validation, clicking on the Test to start the test run.
The pipeline will be installed first (same process as a regular installation).
If installation fails, the Errors tab opens automatically.
Once installed, the pipeline enters Test Mode:
Status changes to Test Mode, and displays the same in the Pipelines Table.
The pipeline enters view-only mode:
You cannot delete nodes, change connections, or edit node/trigger configurations.
You can still update variable values and service settings.
5. Test Cycles & Execution Monitoring
Each test run generates a Test Cycle, labeled with a Test indication.
The active test cycle is automatically selected in the Cycles Panel with its details shown.
In the Executions table, test executions are marked with Test.
Logs and execution views are filtered to display only data from the active test cycle.
6. Completion & Cancellation
Cancel Test:
Click X to exit Test Mode and return to Edit Mode.
If the test is running, the cycle is marked as terminated.
On Completion (Success or Failure):
A Results button appears, linking directly to the selected test cycle in the Pipeline Cycles tab.
A Rerun Test button allows you to repeat the test with the same or updated inputs.
Once the test ends, the pipeline status reverts to Inactive (Edit Mode).
7. Triggers in Test Mode
When running a pipeline in Test Mode, triggers behave differently than in deployed pipelines.
Newly Created Triggers
Installing a pipeline in Test Mode does not automatically activate newly created triggers.
New triggers can only be activated once the pipeline is in Deployed Mode.
Existing Triggers
If active triggers already exist, they will continue collecting events during the test.
SDK Executions
If a user attempts to execute the pipeline via the SDK while the pipeline is in Test Mode, the execution request is queued until the test completes.
8. Persistence Across Sessions
If you leave the pipeline page during or after a test:
Reopening the pipeline will show it in Test Mode if a test is still running.
You can access the Results or run a new test directly.
Visibility:
Ongoing tests in Test Mode are visible to all users.
Completed test results are visible only to the test initiator.
Create Pipeline Using SDK
Learn more about creating pipelines via SDK.