Dataset Nodes
The Dataset node offers flexibility in data pipelines, allowing you to generate a new dataset or use an existing one for filtering or storage. It can be placed at the beginning, middle, or end of the pipeline to streamline data processing.
At the beginning: The Dataset node filters triggered items, ensuring only selected dataset items (and folders, if specified) are processed. However, these items won’t automatically trigger the pipeline; you must use an event trigger, manually execute via the Dataset Browser, or use the Dataloop SDK.
In the middle or end: The Dataset node clones processed items to the specified dataset or folder. If an item already exists at the destination, it is skipped.
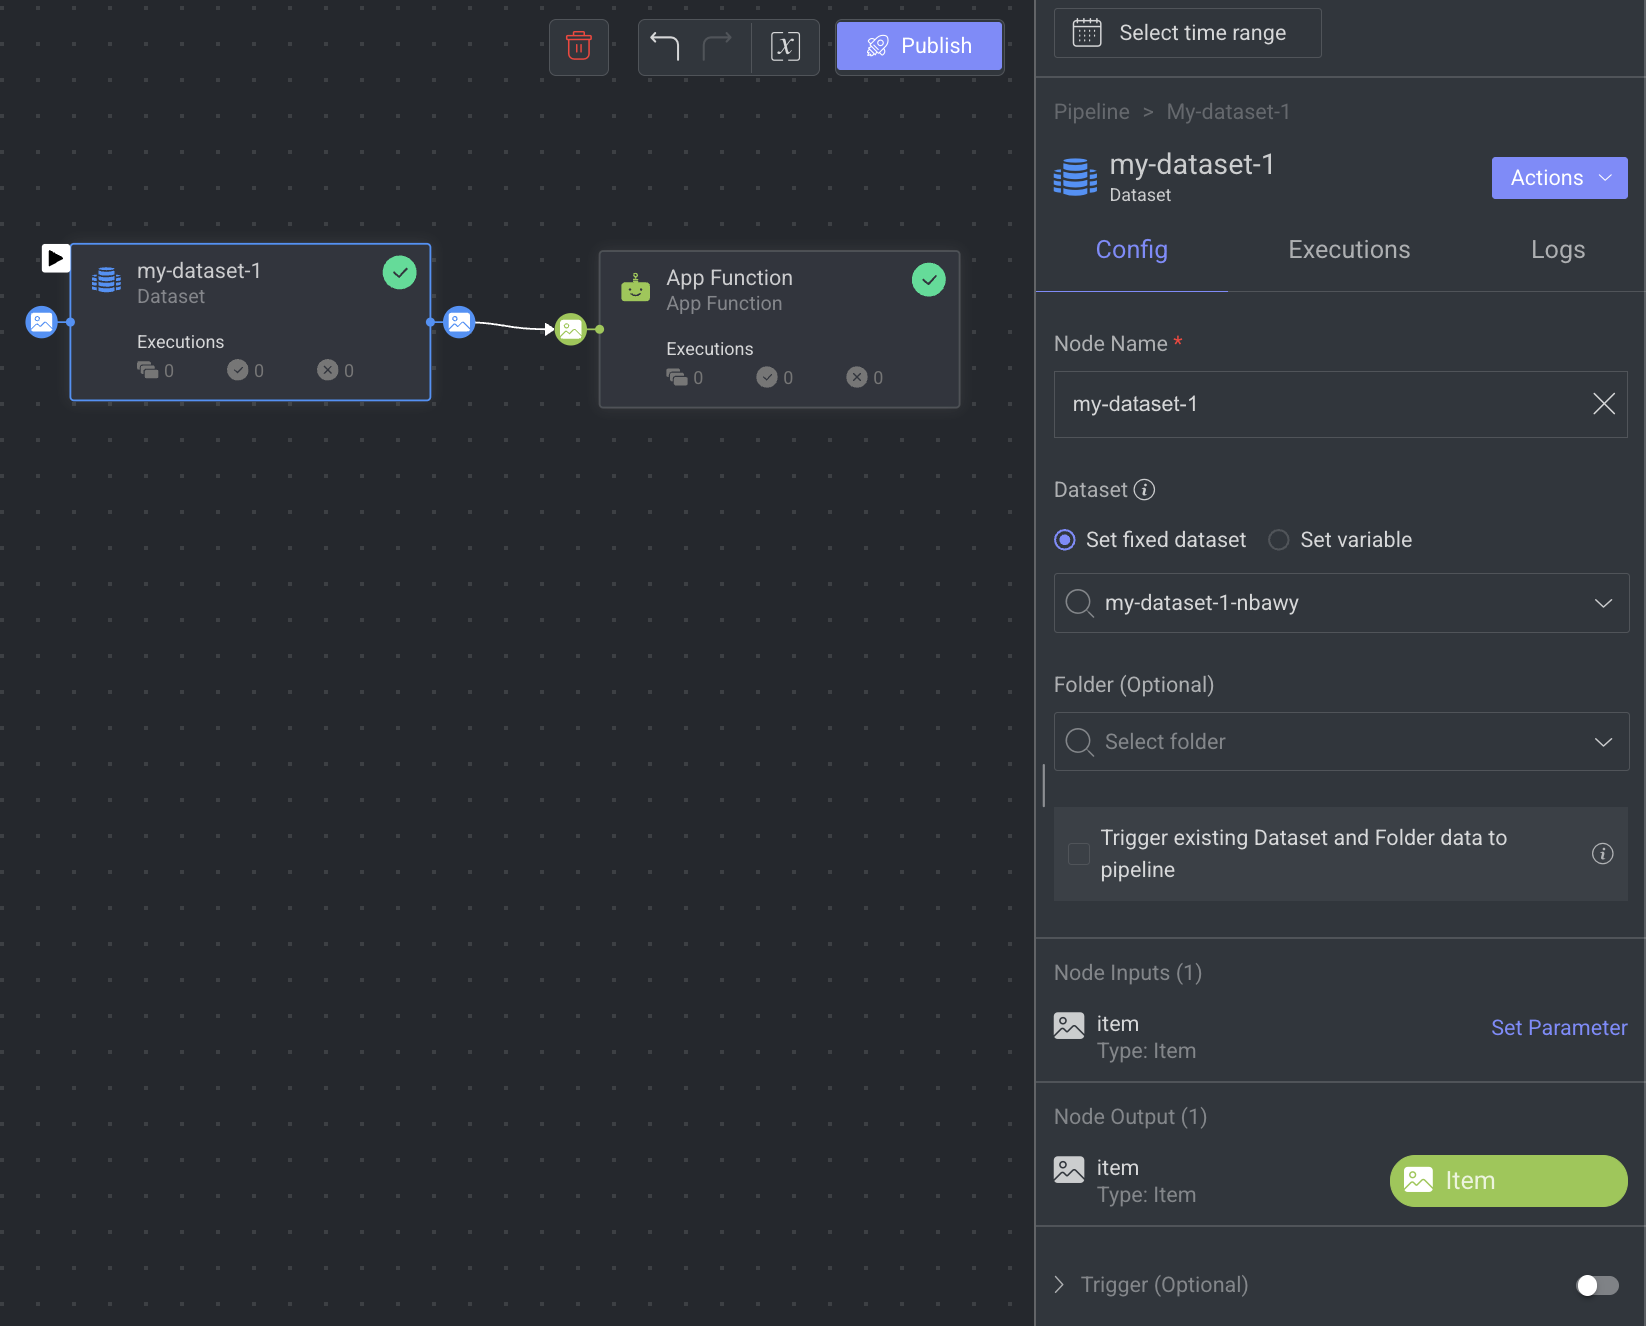
When you click on a Dataset Node, its details, such as Configuration, Executions, Logs, and available Actions are shown on the right-side panel.
Node Name: Provide a name for the dataset node. By default, the name of the node will be displayed.
Dataset: Select an existing dataset, or click Create Dataset to create a new dataset. A Dataset node can only have one output channel and one input channel.
Set Fixed Dataset or Set Variable: It allows you to set the selected dataset as a fixed dataset or set a Pipeline Variable (follow from the Step 3).
Folder (Optional): Select a folder within the selected dataset. This option will not be accessible if no dataset is selected.
Trigger Existing Dataset and Folder Data to the Pipeline:
Enable this option to automatically load existing data into the pipeline dataset node upon activation, based on the chosen dataset, folder, and any DQL filter in the trigger.
This option is only available when this node is the start node.
Note: This is a one-time action and does not re-trigger after changes to the dataset, folder, or filters, or if the pipeline is paused and resumed.
Node Input: Input channels are set to be of type: item by default. Click Set Parameter to set input parameter for the dataset node. For more information, see the Node Inputs article.
Node Output: Output channels are set to be of type: item by default.
Trigger (Optional): You can set an Event Trigger on this node to start the pipeline run from this specific point. Since the Dataset node’s input is items, only the Event trigger type is supported.
When a node is selected, the Executions tab provides details about the execution of each item processed through that node.
- Choose a specific execution from the list to access its detailed information.
- Dataloop stores executions for a maximum of 90 days.
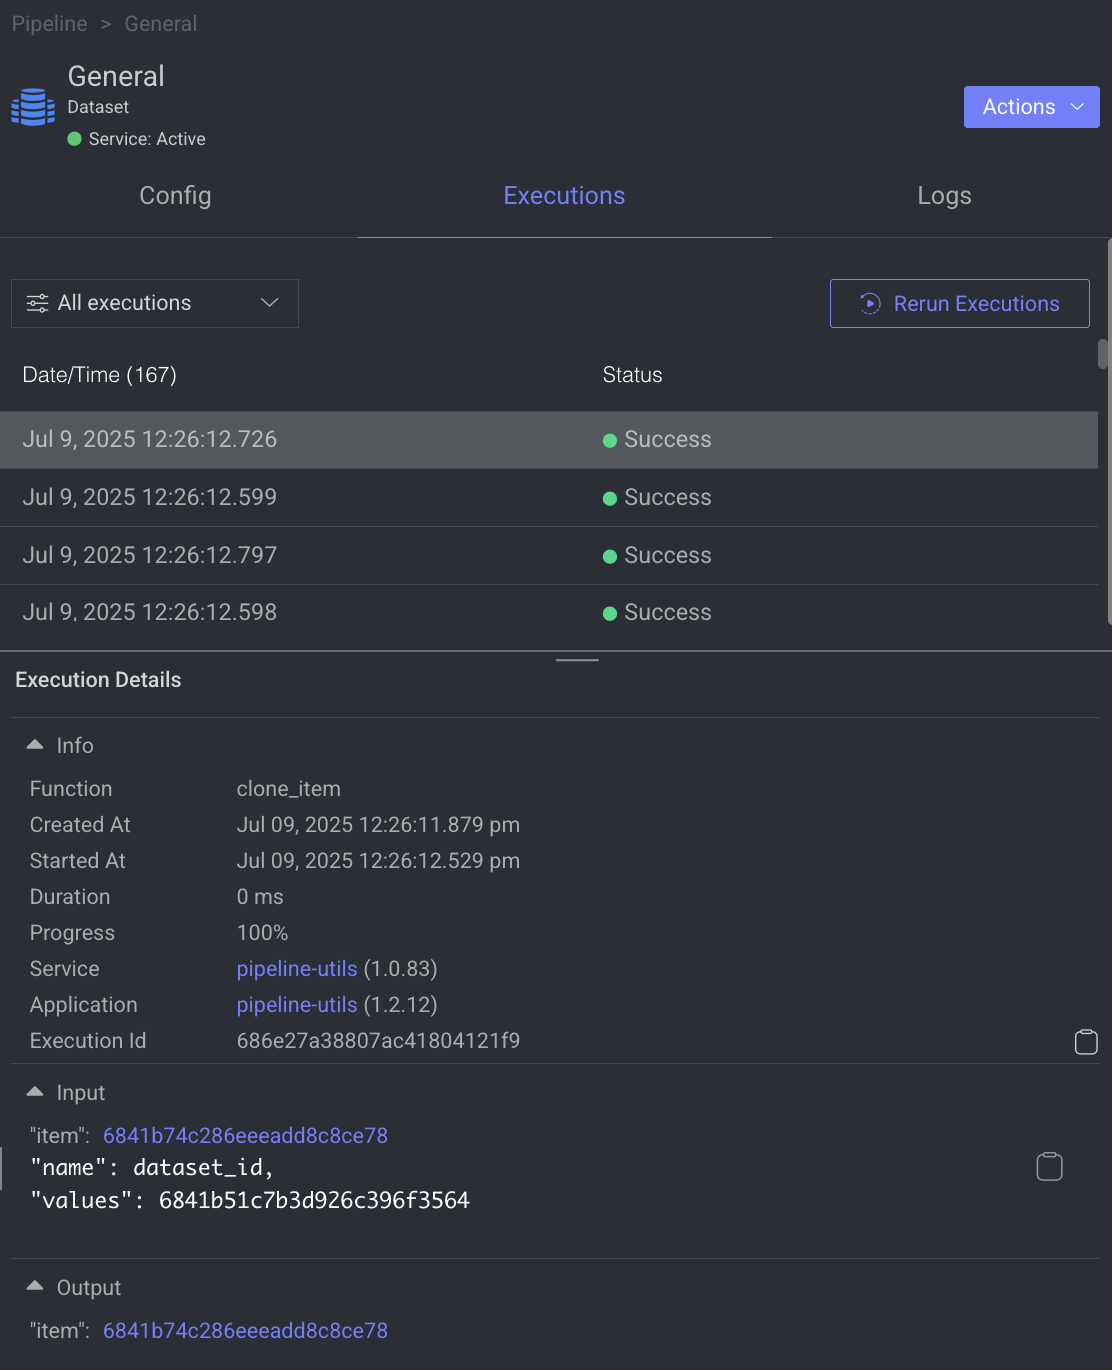
- Use the filter to display executions based on its status.
- Click Rerun Executions to rerun the selected executions. Before you confirm the rerun, you have two actions for the cycles:
- Resume Cycle: Resume the cycles of the selected executions starting from the current node onwards.
- Restart Cycle: Restart the cycles of the selected executions starting from the beginning.
- View Execution details such as Information, Input, and Output.
The Logs tab provides a granular view of what happens behind the scenes when a node executes.
- It showcases all log entries, including function and service level logs, application installation processes (from initialization to completion), generated during executions of the corresponding node within the selected time-frame.
- Dataloop stores logs for a maximum of 14 days.
- Click on the log to view log details in the bottom.
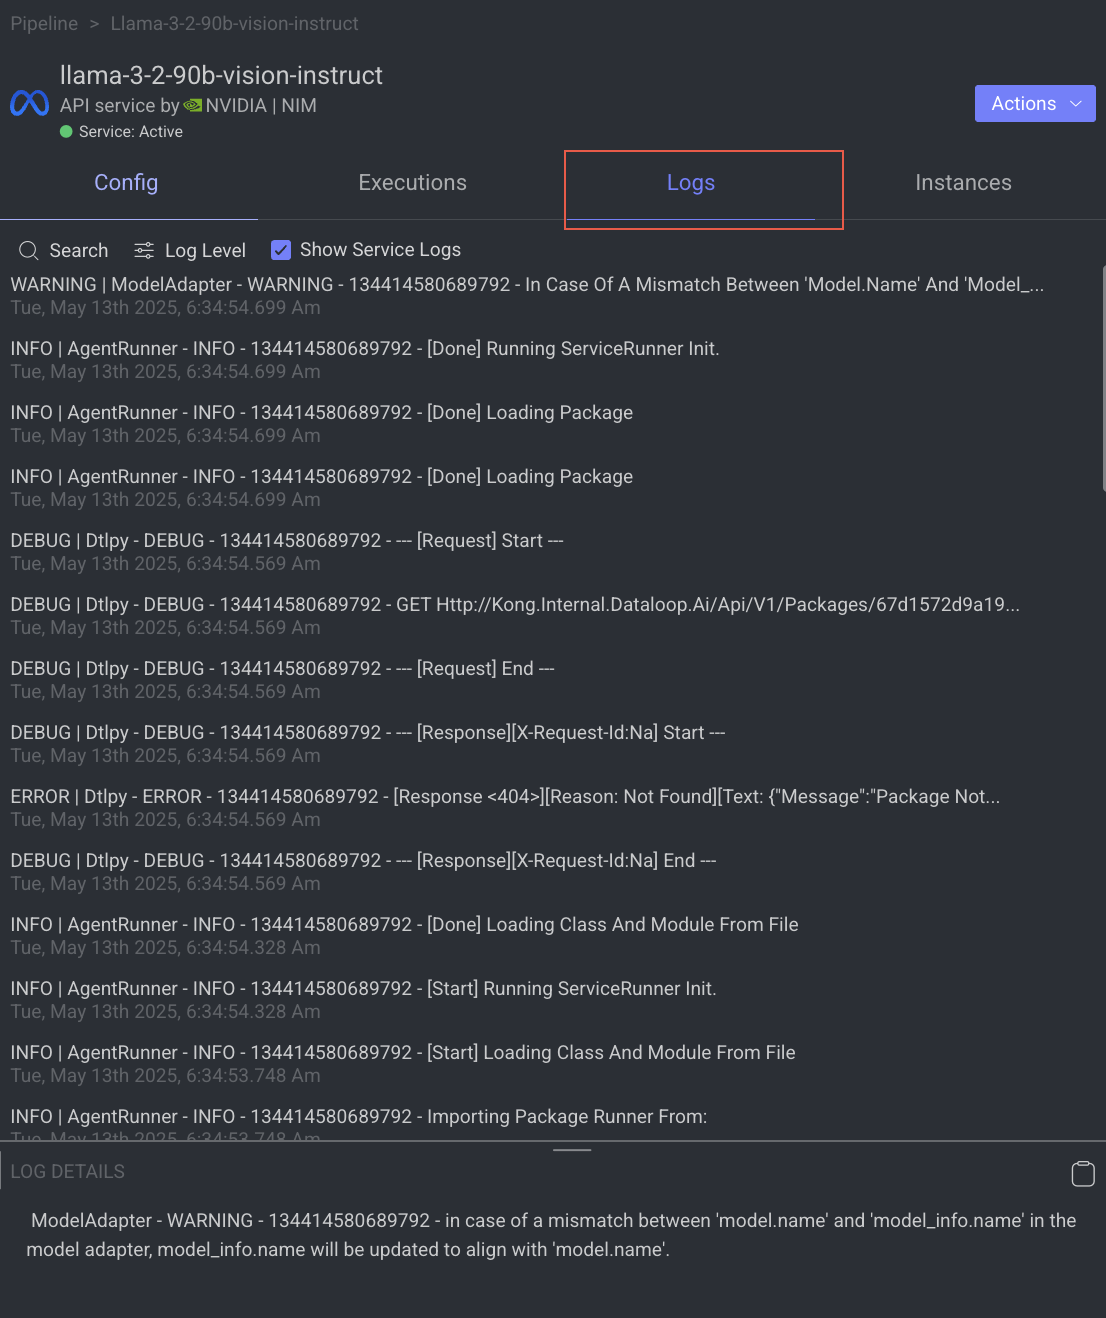
Utilize the following options to navigate through the logs:
- Search: Enter free text to search through the logs.
- Log Level Filter: Filter logs by selecting a level (critical, error, warning, info, debug) to find logs at that level and above.
- Show Service Logs: Show/hide service-level logs, aiding in the debugging and resolution of service-level errors and issues.
Open the Node's Dataset
This option allows you to browse the Dataset that you have selected in the Dataset Node.
Open the Pipelines page and click on the pipeline from the list.
Select the Dataset node.
Click on the Action from the right-side panel.

Click Open Dataset from the list. The Dataset Browser page is displayed.
Copy the Service ID
Copy service ID from a pipeline node.
- Open the Pipelines page and click on the pipeline from the list.
- Select the node from the pipeline.
- Click on the Action from the right-side panel.
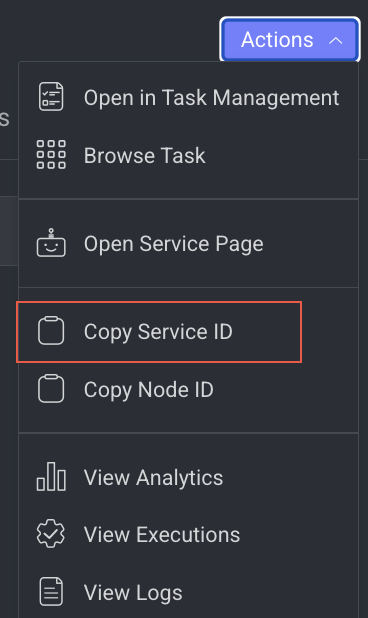
- Click Copy Service ID from the list.
Copy the Node ID
Copy node ID of a pipeline node
- Open the Pipelines page and click on the pipeline from the list.
- Select the node from the pipeline.
- Click on the Action from the right-side panel.
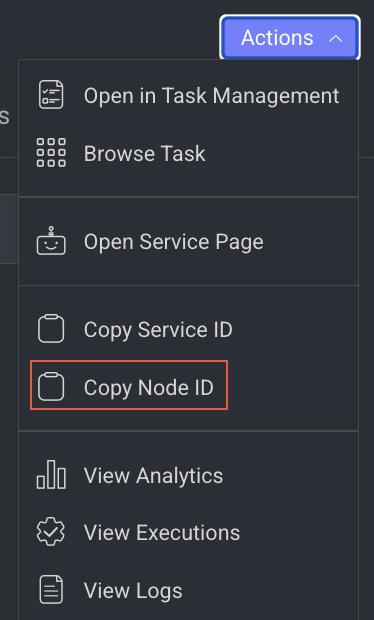
- Click Copy Node ID from the list.
View Log Details
It allows you to view the Logs page of the Application Service from a pipeline node.
- Open the Pipelines page and click on the pipeline from the list.
- Select the node from the pipeline.
- Click on the Action from the right-side panel.
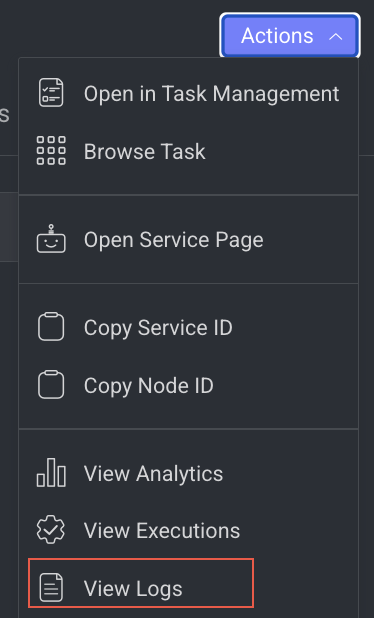
- Click View Logs from the list. The Logs tab of the CloudOps page is displayed.
View Execution Details
It allows you to view the Executions page of the Application Service.
- Open the Pipelines page and click on the pipeline from the list.
- Select the node from the pipeline.
- Click on the Action from the right-side panel.
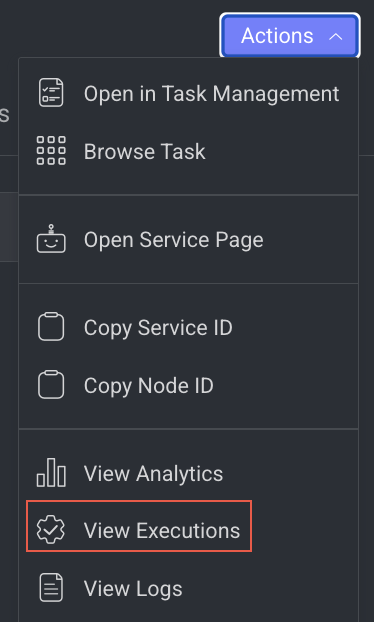
- Click View Executions from the list. The Executions tab of the CloudOps Service page is displayed.
View Analytics Details
It allows you to view the Monitoring tab of the Application Service.
- Open the Pipelines page and click on the pipeline from the list.
- Select the node from the pipeline.
- Click on the Action from the right-side panel.
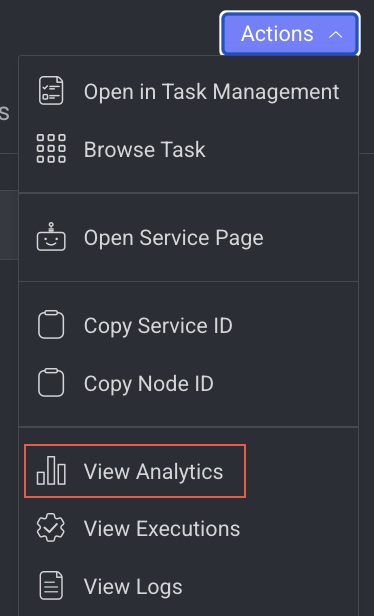
- Click View Analytics from the list. The Monitoring tab of the Application Service page is displayed.
Update Variable Nodes
The Update Variable node allows you to manage the pipeline variables and update their values dynamically in real-time during pipeline execution.
You can select the required variables from the dropdown list.
The node input/output will be updated automatically according to your selection.
When the Update Variable node executes, the node delivered input will be set as the new value for the variable.
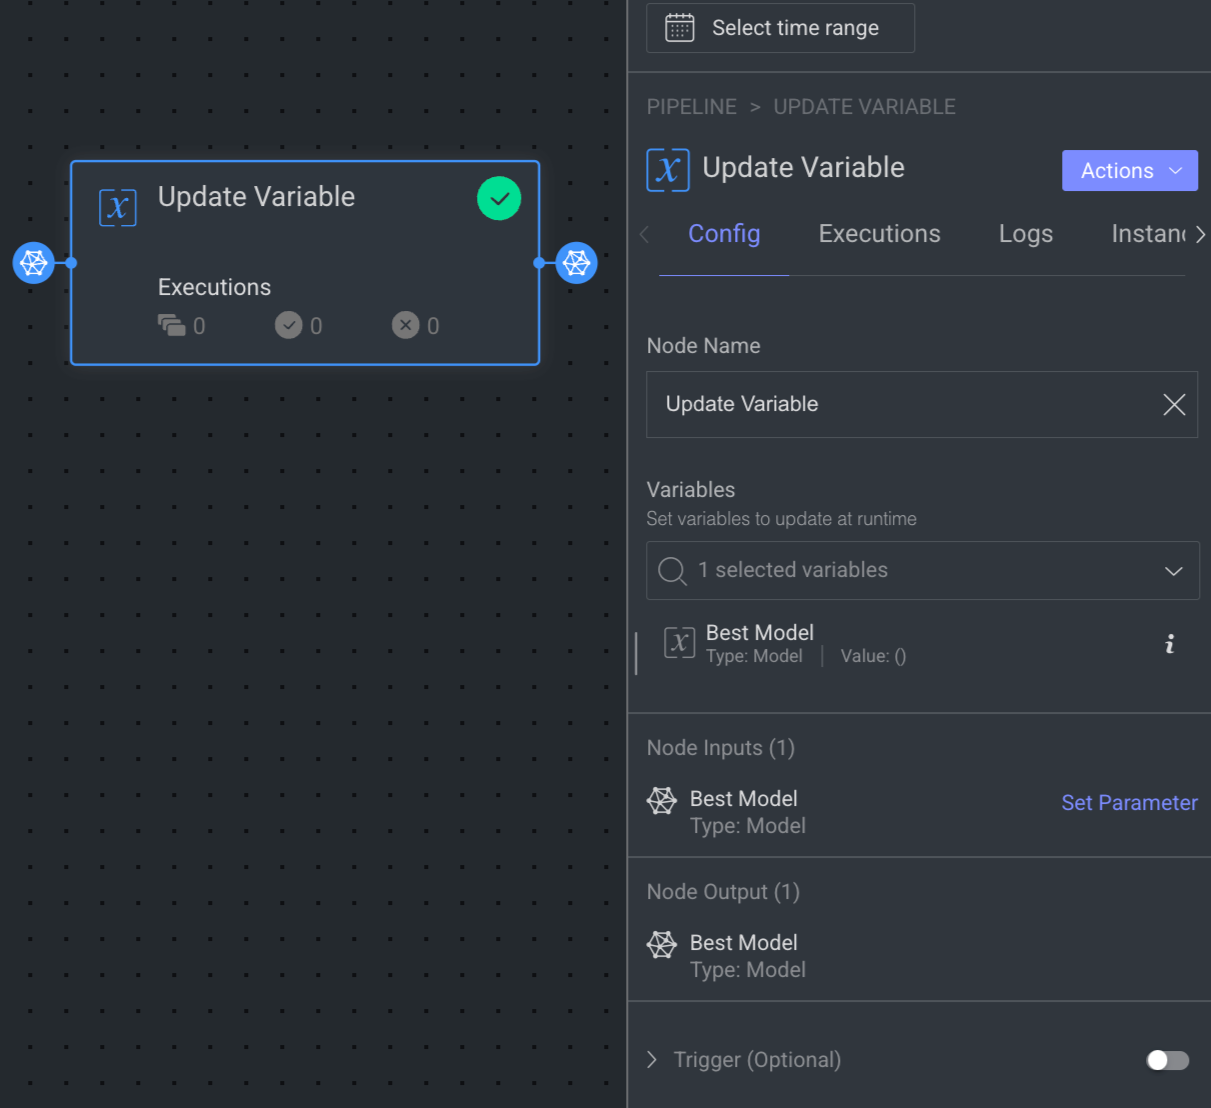
When you click on an Update Variable node, its details, such as Configuration, Executions, Logs, Instances, and available Actions are shown on the right-side panel.
Node Name: By default, Update Variable is displayed as name. Make changes accordingly.
Variables: Select required variables from the dropdown list, or create a new one.
Node Input: It will be set automatically after selecting a variable. Click Set Parameter to set input parameter for the dataset node. For more information, see the Node Inputs article.
Node Output: It will be set automatically after selecting a variable.
Trigger (Optional): An Event/Cron Triggers can be set on this node, enabling you to initiate the pipeline run from this specific point.
When a node is selected, the Executions tab provides details about the execution of each item processed through that node.
- Choose a specific execution from the list to access its detailed information.
- Dataloop stores executions for a maximum of 90 days.
- Use the filter to display executions based on its status.
- Click Rerun Executions to rerun the selected executions. Before you confirm the rerun, you have two actions for the cycles:
- Resume Cycle: Resume the cycles of the selected executions starting from the current node onwards.
- Restart Cycle: Restart the cycles of the selected executions starting from the beginning.
- View Execution details such as Information, Input, and Output.
The Logs tab provides a granular view of what happens behind the scenes when a node executes.
- It showcases all log entries, including function and service level logs, application installation processes (from initialization to completion), generated during executions of the corresponding node within the selected time-frame.
- Dataloop stores logs for a maximum of 14 days.
- Click on the log to view log details in the bottom.
Utilize the following options to navigate through the logs:
- Search: Enter free text to search through the logs.
- Log Level Filter: Filter logs by selecting a level (critical, error, warning, info, debug) to find logs at that level and above.
- Show Service Logs: Show/hide service-level logs, aiding in the debugging and resolution of service-level errors and issues.
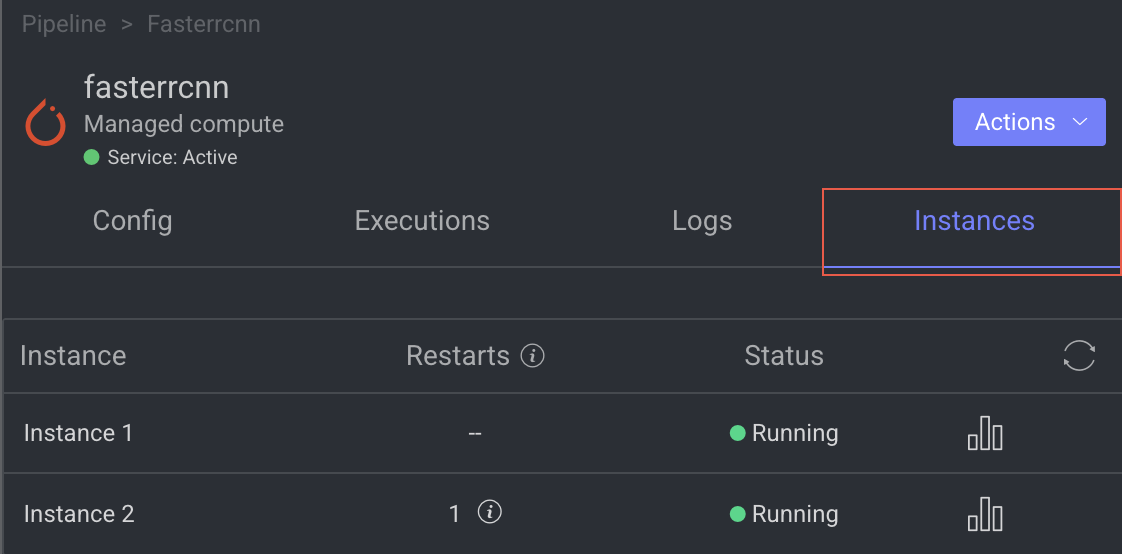
The Instance tab displays all available instances (replicas of services or machines) of the node service, along with their current status—such as 🟡 Initializing, 🟢 Running, or 🔴 Failed.
- It also indicates the number of restarts for each instance, which is useful for identifying services that are failing to activate and continuously restarting.
- Additionally, a monitoring icon is available for each instance. Clicking this icon redirects you to the Instances section of the Service page, where you can monitor detailed health metrics such as CPU and memory usage for each instance.
Update Variable Node’s Actions

Open the Service Page
Open the service page of a pipeline node where you can see Monitoring, Executions, Logs, Triggers, and Instances information of the service. It will be available once you set a model.
- Open the Pipelines page and click on the pipeline from the list.
- Select the node from the pipeline.
- Click on the Action from the right-side panel.
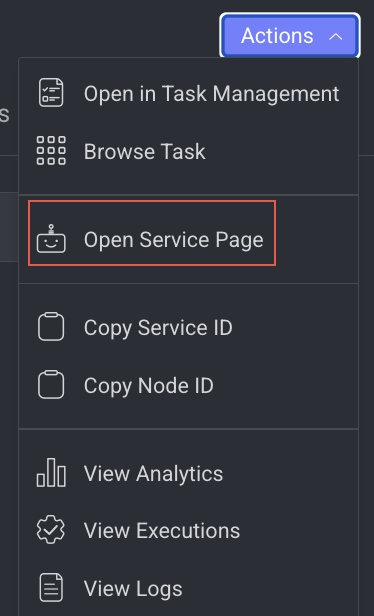
- Click Open Service Page from the list. The Monitoring tab of the service page is displayed.
Copy the Service ID
Copy service ID from a pipeline node.
- Open the Pipelines page and click on the pipeline from the list.
- Select the node from the pipeline.
- Click on the Action from the right-side panel.
- Click Copy Service ID from the list.
Copy the Node ID
Copy node ID of a pipeline node
- Open the Pipelines page and click on the pipeline from the list.
- Select the node from the pipeline.
- Click on the Action from the right-side panel.
- Click Copy Node ID from the list.
View Log Details
It allows you to view the Logs page of the Application Service from a pipeline node.
- Open the Pipelines page and click on the pipeline from the list.
- Select the node from the pipeline.
- Click on the Action from the right-side panel.
- Click View Logs from the list. The Logs tab of the CloudOps page is displayed.
View Execution Details
It allows you to view the Executions page of the Application Service.
- Open the Pipelines page and click on the pipeline from the list.
- Select the node from the pipeline.
- Click on the Action from the right-side panel.
- Click View Executions from the list. The Executions tab of the CloudOps Service page is displayed.
View Analytics Details
It allows you to view the Monitoring tab of the Application Service.
- Open the Pipelines page and click on the pipeline from the list.
- Select the node from the pipeline.
- Click on the Action from the right-side panel.
- Click View Analytics from the list. The Monitoring tab of the Application Service page is displayed.
Data Split Nodes
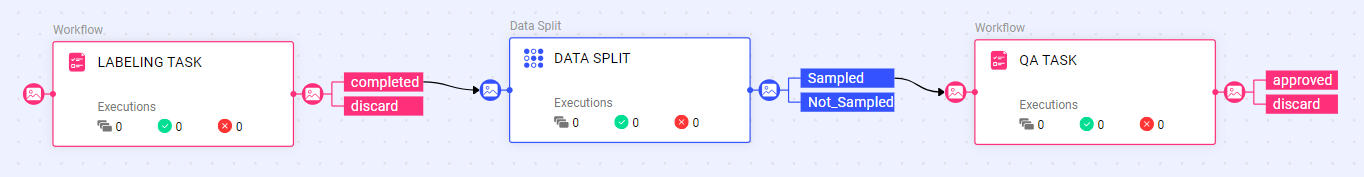
The Data Split node is a powerful data processing tool that allows you to randomly split your data into multiple groups at runtime. Whether you need to sample items for QA tasks or allocate your ground truth into training, test, and validation sets, the Data Split node simplifies the process.
Simply define the groups, set their distribution, and optionally tag each item with its assigned group. The tag will be appended to the item's metadata under metadata.system.tags (list). Use the Data Split node at any point in the pipeline to tailor the data processing.
Groups limitations
Minimum groups: 2
Maximum groups: 5
Distribution must sum up to 100%
For instance, to sample 20% of the annotated data for review (QA Task), create two groups ("Sampled"/"Not_Sampled") and set the required distribution (20-80). Afterward, add a node connection from the "Sampled" group to the QA task, ensuring that only 20% of the data is directed for QA during runtime.
The Data Split node details are presented in four tabs as follows:
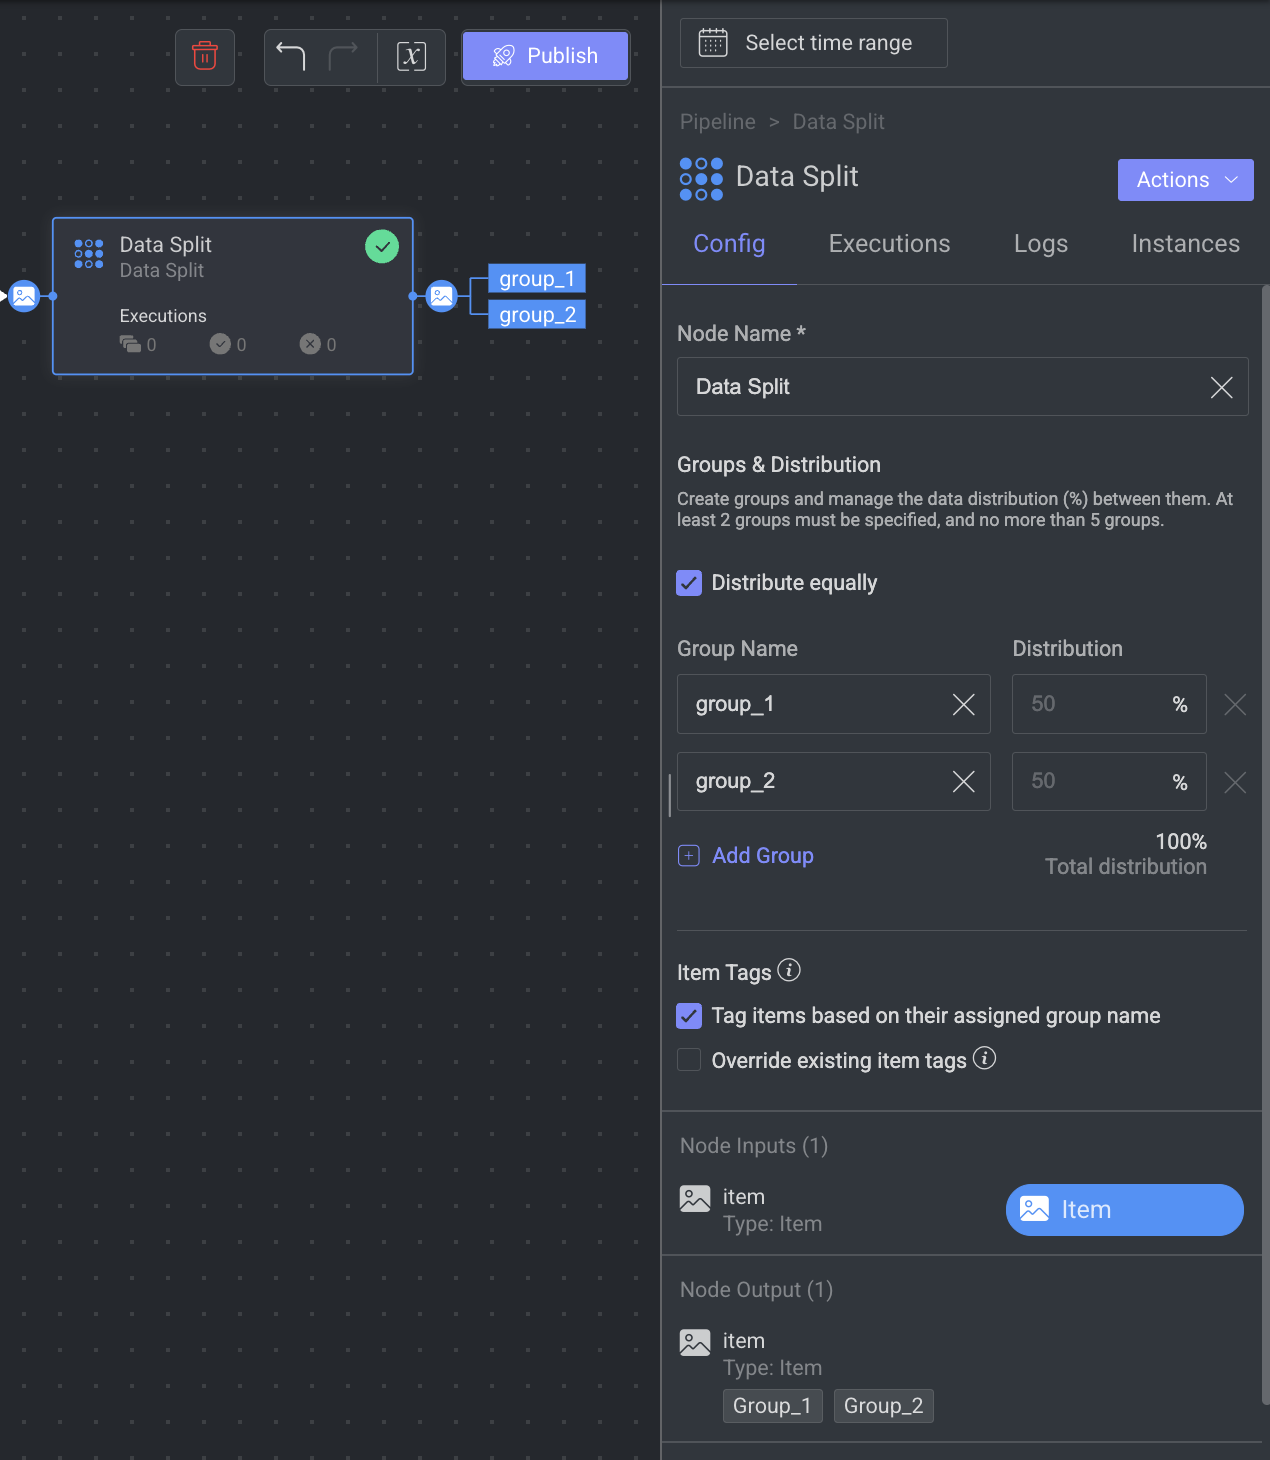
Node Name: Display name on the canvas.
Groups and Distribution: Allows to create groups and manage data distribution (%). At least 2 groups must be specified, and no more than 5 groups.
Distribute equally: Mark this option to force equal distribution between the groups.
Group Name and Distribution fields: Enter the name for the groups and add distribution percentages.
Item Tags:
Tag items based on their assigned group name: By default, this option allows you to add a metadata tag items once they are assigned to a group. The tag will be the group name and will be added to the item's metadata field:
metadata.system.tags (list).Override existing item tags: When you select this option, the tags that are already available in the items will be replaced with the newly assigned tag. This option will be disabled, if you unselect the above option.
Node Input: item that will be automatically assigned to a group (randomly, based on the required distribution). Click Set Parameter to set input parameter for the Data Split node. For more information, see the Node Inputs article.
Node Output: The output will be set automatically according to the defined groups.
Trigger (Optional): An Event/Cron trigger can be set on this node, enabling you to initiate the pipeline run from this specific point.
When a node is selected, the Executions tab provides details about the execution of each item processed through that node.
- Choose a specific execution from the list to access its detailed information.
- Dataloop stores executions for a maximum of 90 days.
- Use the filter to display executions based on its status.
- Click Rerun Executions to rerun the selected executions. Before you confirm the rerun, you have two actions for the cycles:
- Resume Cycle: Resume the cycles of the selected executions starting from the current node onwards.
- Restart Cycle: Restart the cycles of the selected executions starting from the beginning.
- View Execution details such as Information, Input, and Output.
The Logs tab provides a granular view of what happens behind the scenes when a node executes.
- It showcases all log entries, including function and service level logs, application installation processes (from initialization to completion), generated during executions of the corresponding node within the selected time-frame.
- Dataloop stores logs for a maximum of 14 days.
- Click on the log to view log details in the bottom.
Utilize the following options to navigate through the logs:
- Search: Enter free text to search through the logs.
- Log Level Filter: Filter logs by selecting a level (critical, error, warning, info, debug) to find logs at that level and above.
- Show Service Logs: Show/hide service-level logs, aiding in the debugging and resolution of service-level errors and issues.
The Instance tab displays all available instances (replicas of services or machines) of the node service, along with their current status—such as 🟡 Initializing, 🟢 Running, or 🔴 Failed.
- It also indicates the number of restarts for each instance, which is useful for identifying services that are failing to activate and continuously restarting.
- Additionally, a monitoring icon is available for each instance. Clicking this icon redirects you to the Instances section of the Service page, where you can monitor detailed health metrics such as CPU and memory usage for each instance.
More Actions

Edit Service Settings
It allows you to make changes to the service settings like Integrations, Service Configuration, and Execution Configuration based on the model you have selected. This option is not available for Train and Validation.
You can now edit the service configuration of a node even while running a pipeline, providing greater flexibility.
- Open the Pipelines page and click on the pipeline from the list.
- Select the node from the pipeline.
- Click on the Action from the right-side panel.
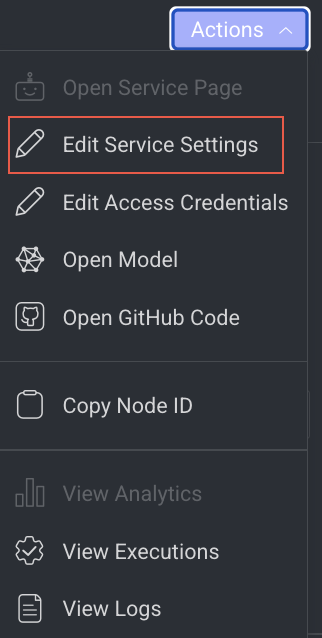
- Click Edit Service Settings from the list. The Edit Service Setting popup window of the service is displayed.
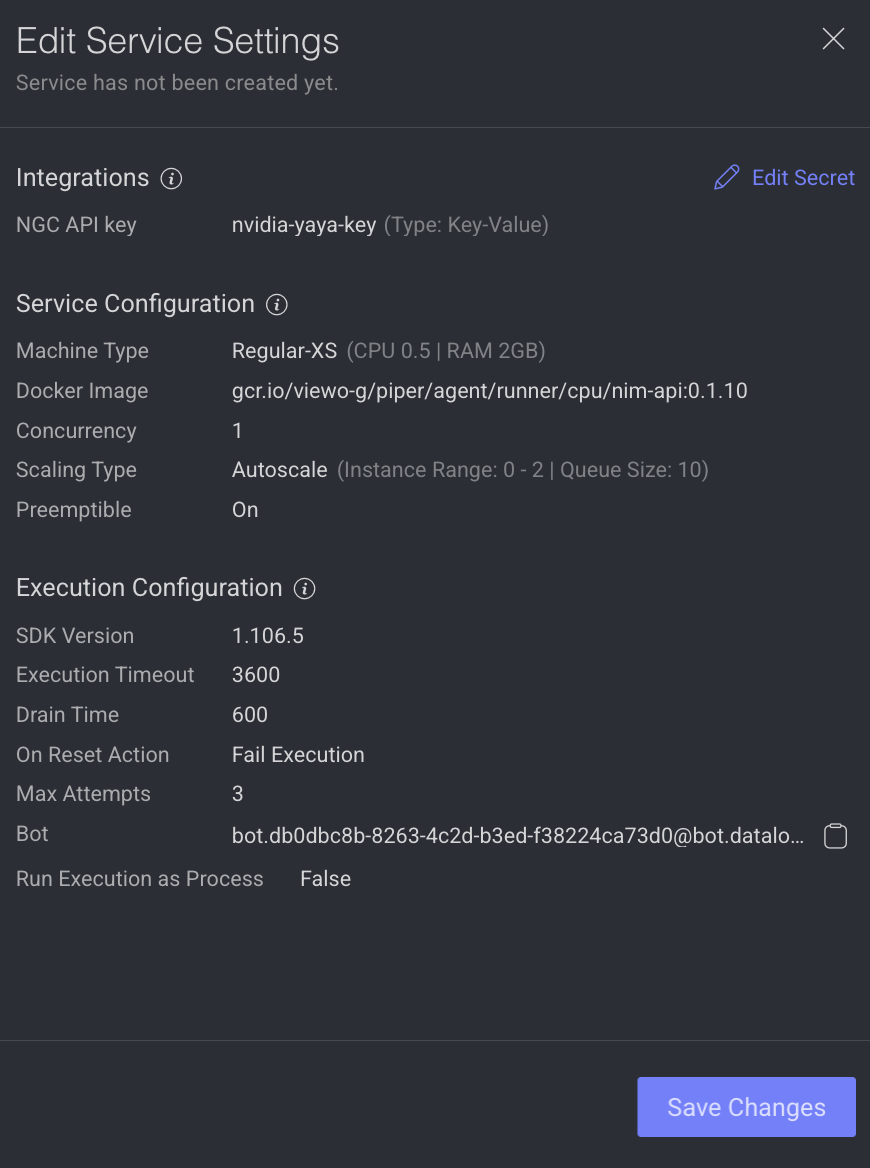
Integrations
The secret values are displayed, if the secret is defined in the dpk/dpkConfig. Click on the Edit Secret to search and select a secret from the list.
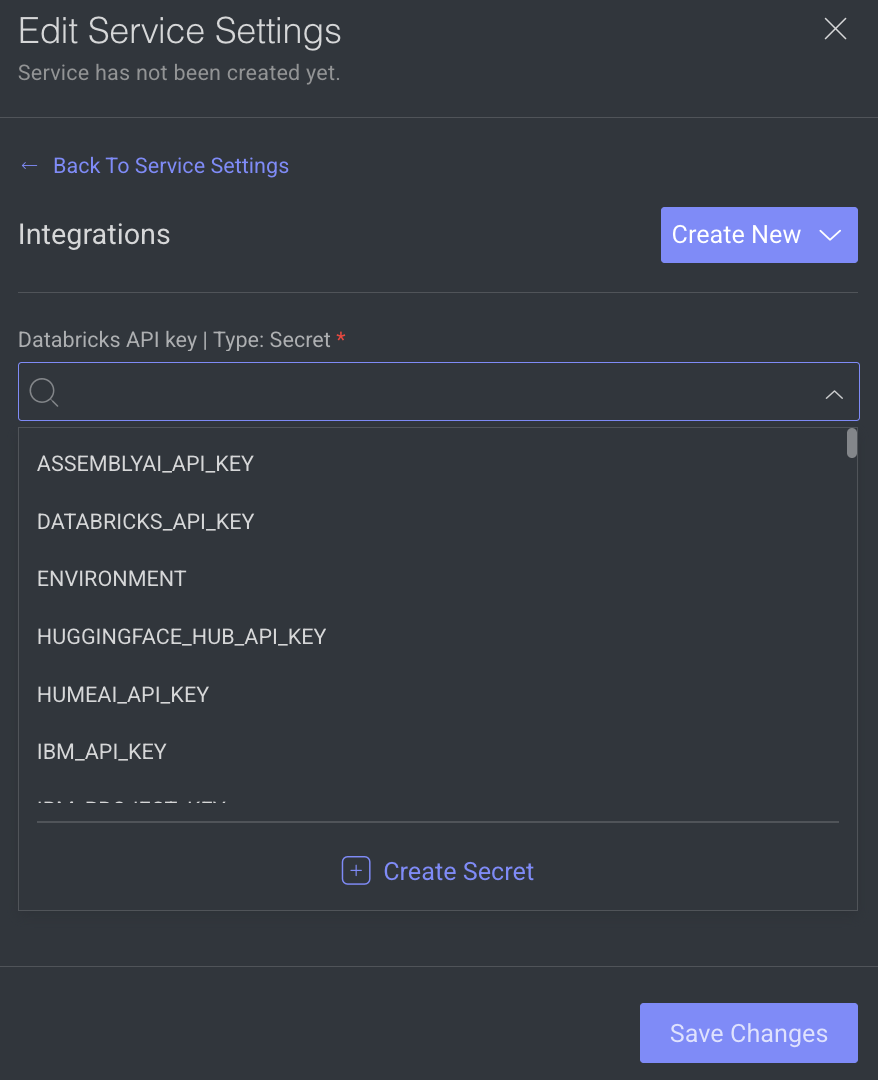
- To create a new secret, click Create New -> Create Secret.
- To create a new Integration, click Create New -> Create Integration.
- Click Save Changes, if no additional modifications are needed.
Service Configuration
The service configuration section allows making changes to the following parameters, to change, click on the Edit Configuration.
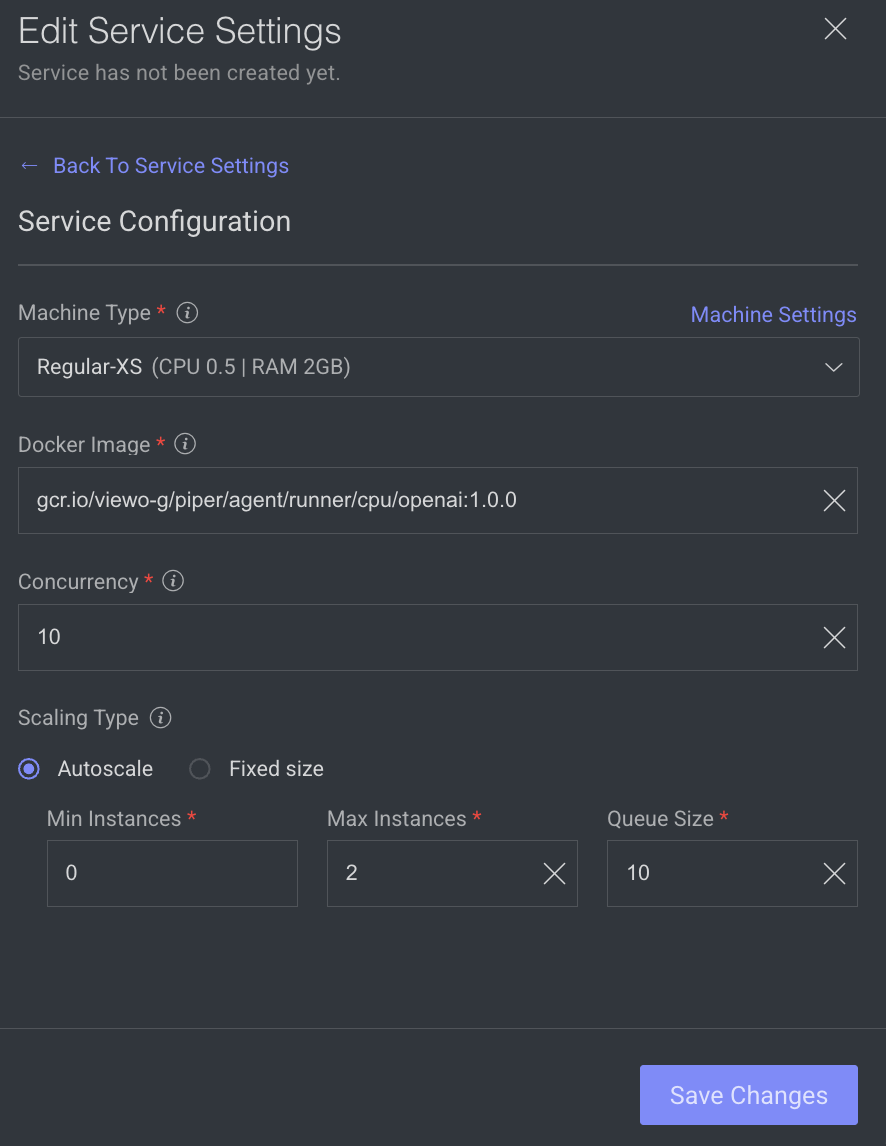
- Machine Types: The machine type on which the service will run (refers to CPU, GPU, RAM).
- Change the machine type from the list.
- Click on the Machine Settings to enable Preemptible Machine, the reclaimable compute instances.
- Docker Image: A container image encapsulating essential dependencies and code for service execution. By default, the docker image based on the SDK version is displayed. You can modify the URL as required.
- Concurrency: Number of concurrent executions per instance. By default, the value 10 is displayed.
- Scaling Type: Choose the scaling type based on your workload.
- Autoscale: Recommended by default. Autoscaling dynamically adjusts the number of service instances based on the incoming execution load, suitable for changing workloads. When autoscaler reduces instances, it waits for execution timeout before termination.
Min Instances: By default, 0. If you set the min instances to 0, the service will not run until it has something in the queue, it will be suspended.Max Instances: By Default, 2.Queue Size: By default, 10.
- Fixed size: Use fixed scaling when you need a predetermined number of service instances, suitable for consistent workloads. Compute hours counts also when there is no workload. By default, 1 instance is selected.
- Autoscale: Recommended by default. Autoscaling dynamically adjusts the number of service instances based on the incoming execution load, suitable for changing workloads. When autoscaler reduces instances, it waits for execution timeout before termination.
- Click Save Changes, if no additional modifications are needed.
Execution Configuration
The execution configuration section allows making changes to the following parameters, to change, click on the Edit Configuration.
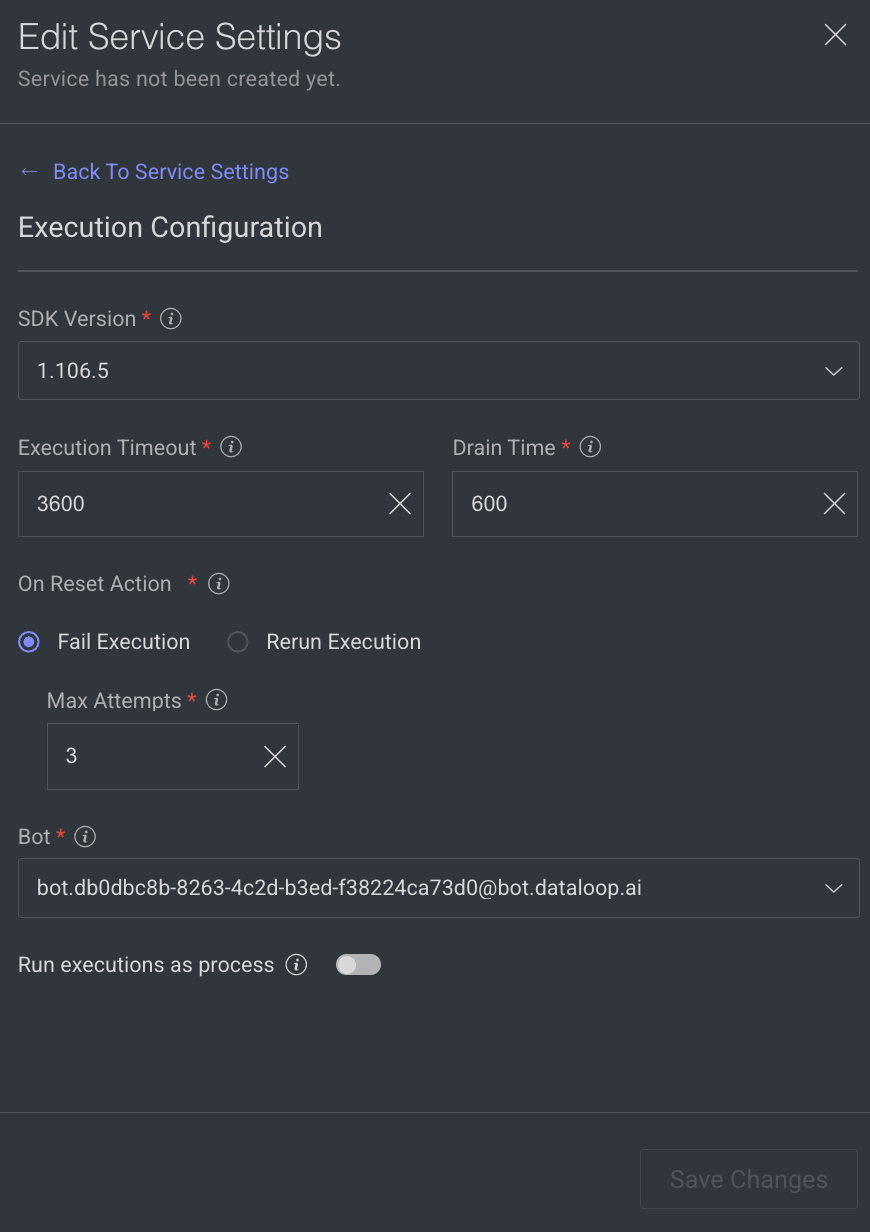
- SDK Version: The SDK version is displayed. Click to select a new version from the list.
- Execution Timeout: The maximum execution duration before service restarts (in seconds). By default, 3600 is displayed.
Drain Time: Delays service restart to complete ongoing executions (in seconds). By default, 600 is displayed.On Reset Action: Action taken when a service is reset or restarted (e.g. timeout). Select one of the following when you reset the execution.- Fail Execution
- Rerun Execution
Max Attempts: Configures to automatically retry failed executions up to x attempts. Maximum number of execution attempts allowed. By default, 3 is displayed.- Bot: A dummy user used for running the service ('developer' role). A default Bot is displayed. Select a new one from the list, if needed.
Rerun executions as process: Defines if each execution will start a new thread or a process. Enable to make the execution as a process.- Click Save Changes.
Edit Access Credentials
You can edit access credentials for models to easily select API keys for seamless application integration.
- Open the Pipelines page and click on the pipeline from the list.
- Select a model node from the pipeline.
- Click on the Action from the right-side panel.
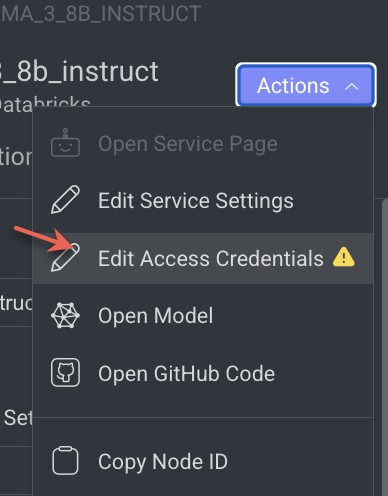
- Click Edit Access Credentials from the list. The Set Credentials popup window is displayed.
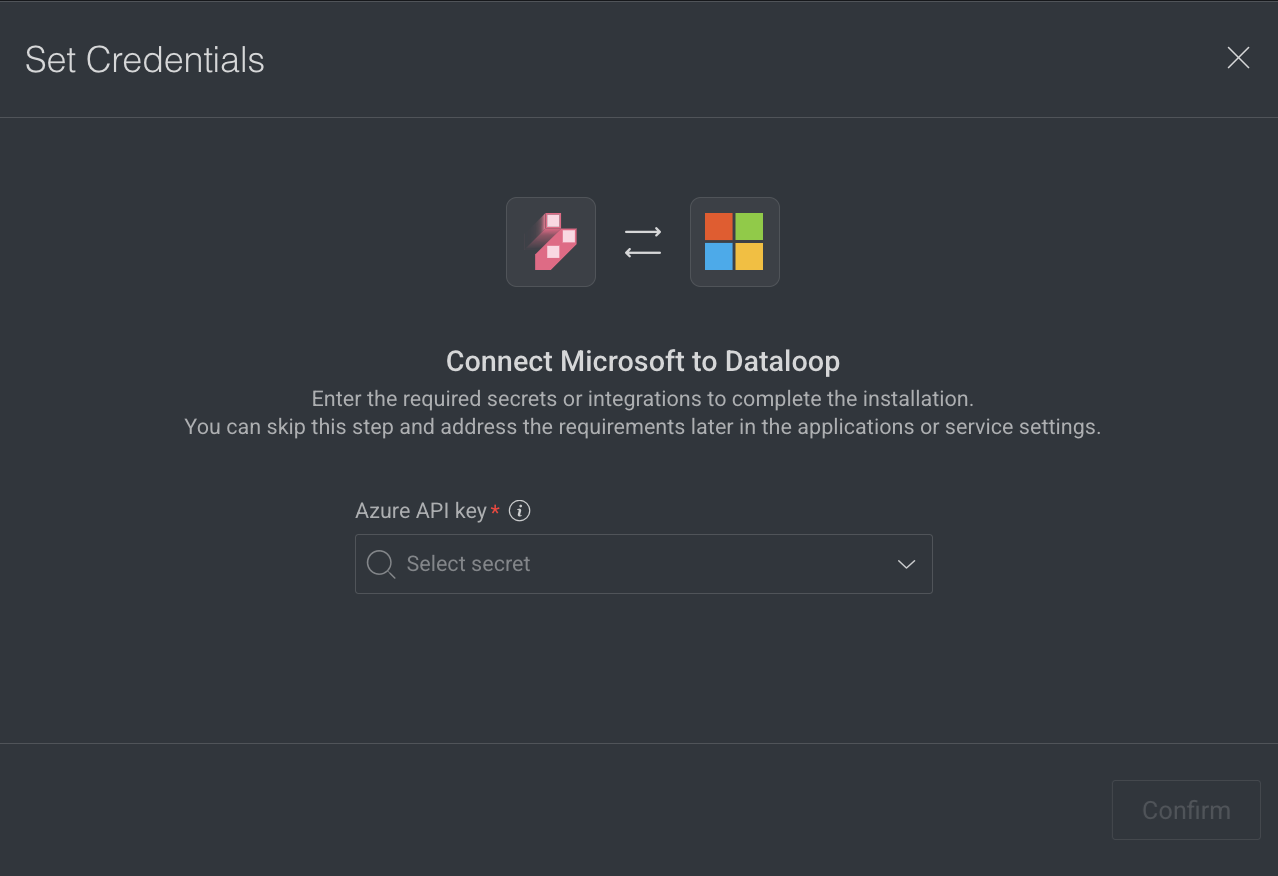
- Select the API Key from the list.
- Click Confirm.
Open GitHub Code
It allows you to open the GitHub Code reference for the selected model. It will be unavailable if there is no fixed model selected.
- Open the Pipelines page and click on the pipeline from the list.
- Select the node from the pipeline.
- Click on the Action from the right-side panel.
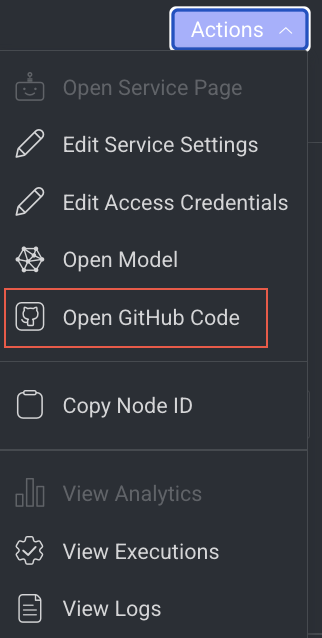
- Click Open GitHub Code from the list. The GitHub page of the selected model is displayed.
Copy the Node ID
Copy node ID of a pipeline node
- Open the Pipelines page and click on the pipeline from the list.
- Select the node from the pipeline.
- Click on the Action from the right-side panel.
- Click Copy Node ID from the list.
View Execution Details
It allows you to view the Executions page of the Application Service.
- Open the Pipelines page and click on the pipeline from the list.
- Select the node from the pipeline.
- Click on the Action from the right-side panel.
- Click View Executions from the list. The Executions tab of the CloudOps Service page is displayed.
View Log Details
It allows you to view the Logs page of the Application Service from a pipeline node.
- Open the Pipelines page and click on the pipeline from the list.
- Select the node from the pipeline.
- Click on the Action from the right-side panel.
- Click View Logs from the list. The Logs tab of the CloudOps page is displayed.