Overview
The executions tab displays the list of service executions and its details in all the projects. View total number of executions, number of success and failed executions. DDOE stores executions for a maximum of 90 days.
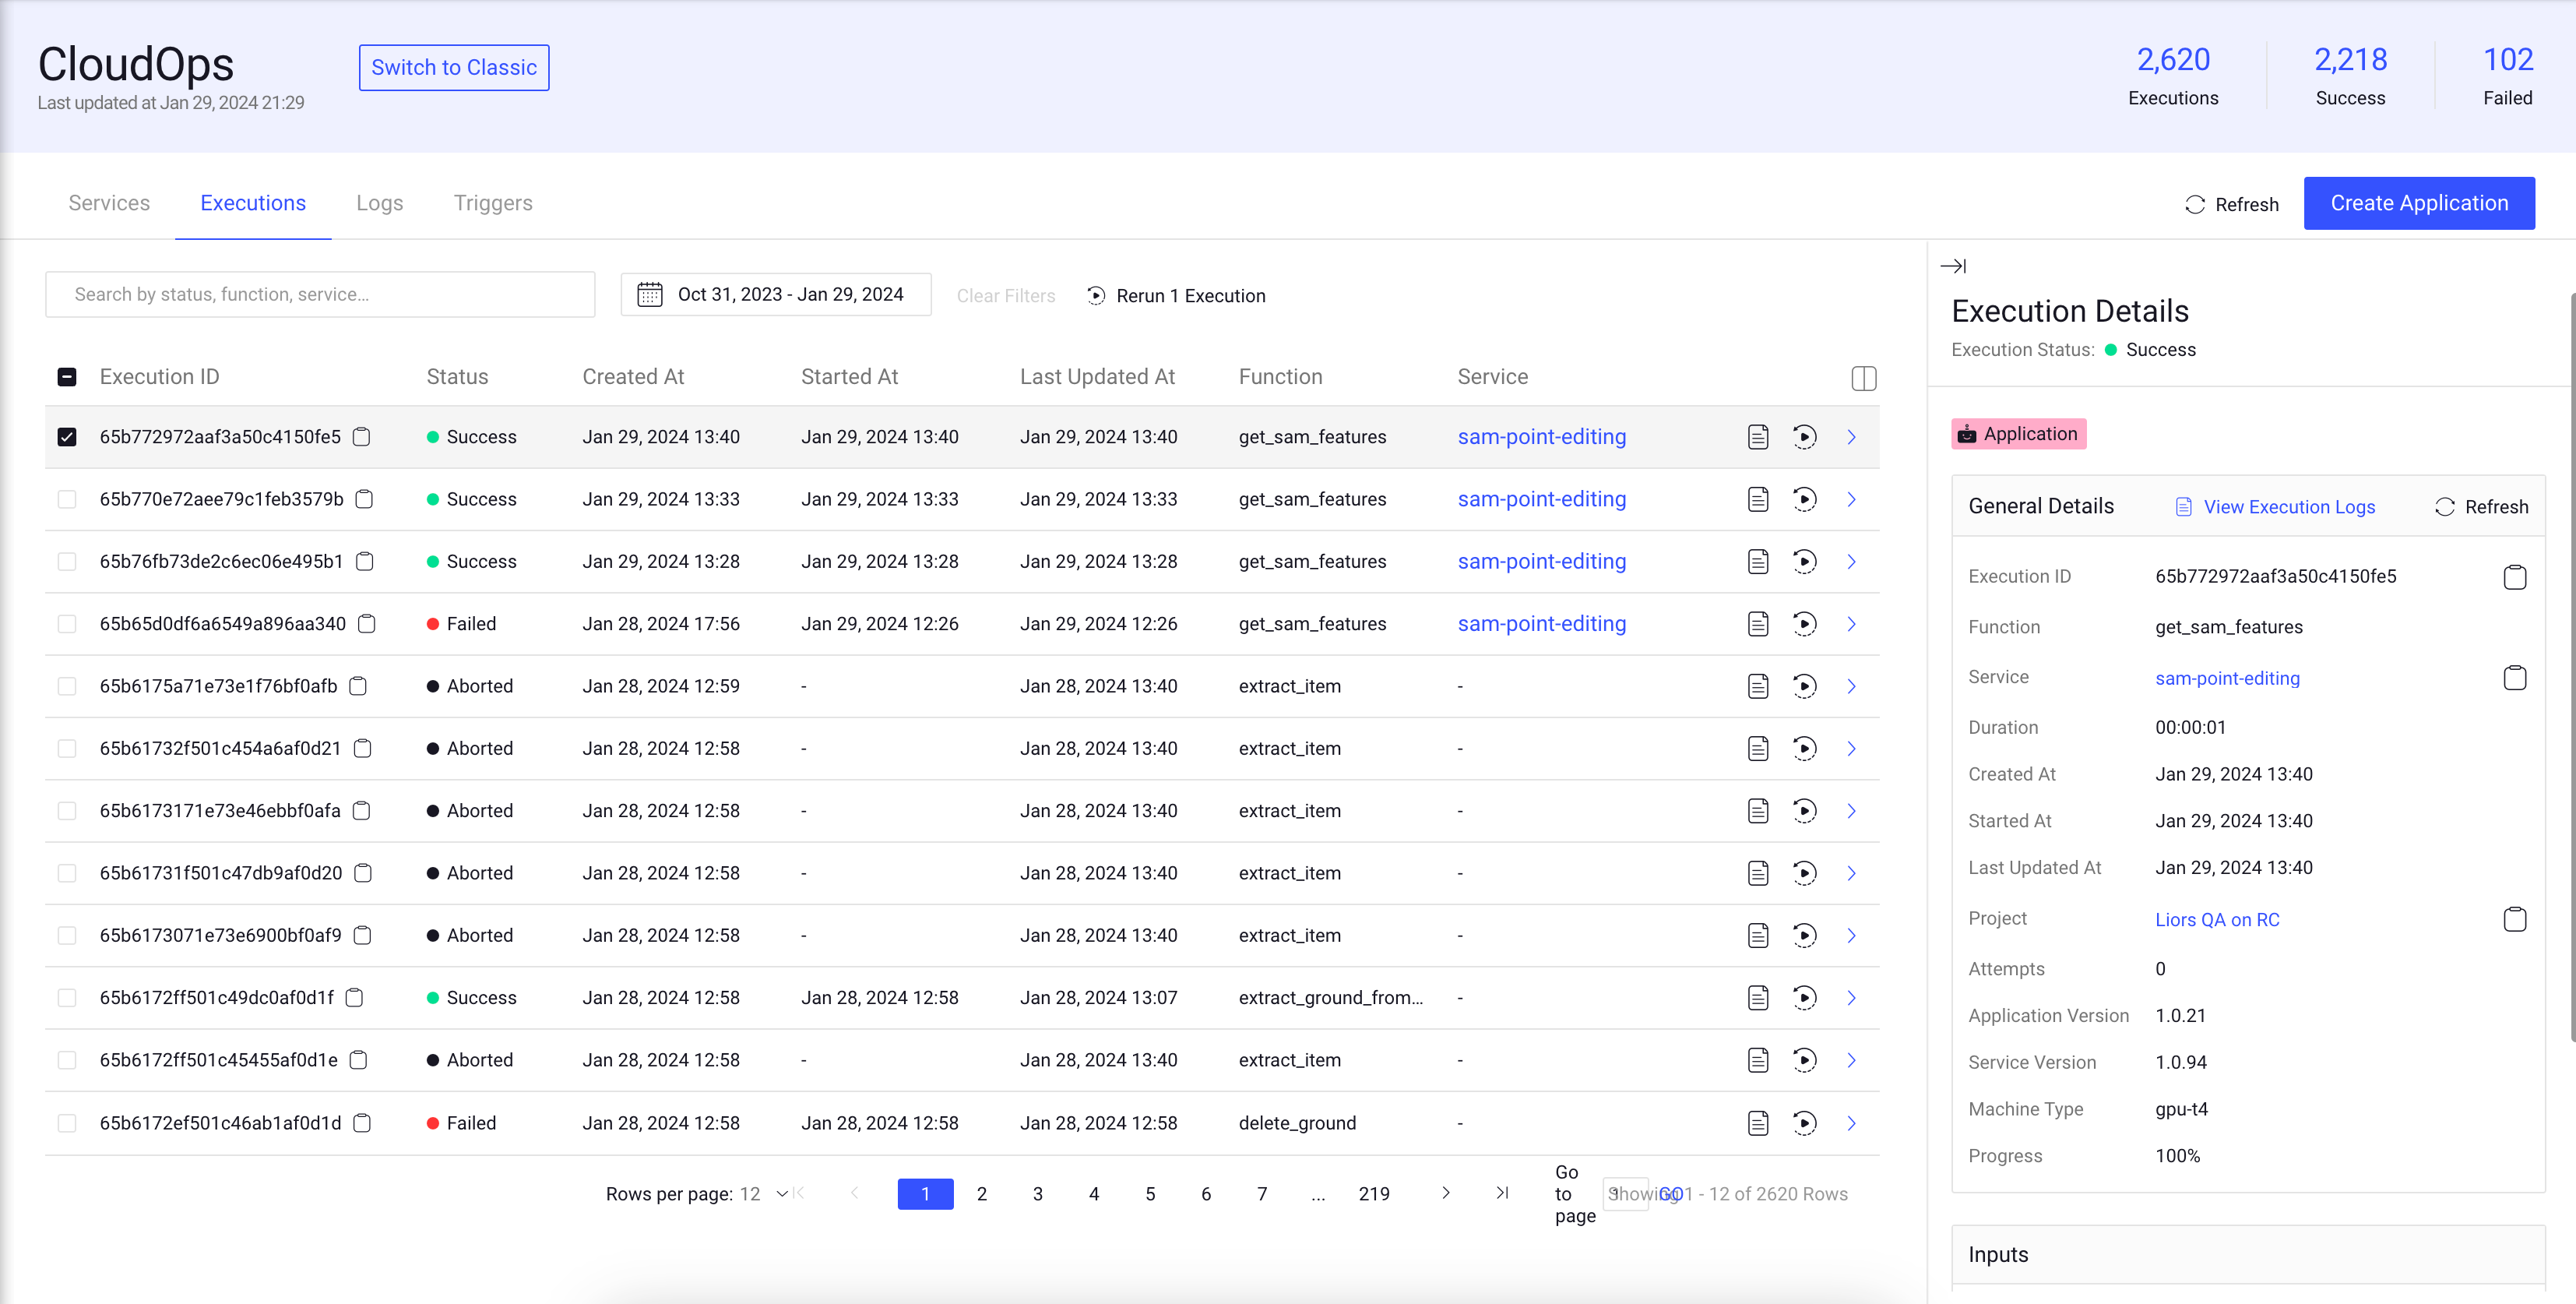
The list of execution shows the following column details:
Fields | Description |
|---|---|
Execution ID | An unique ID of the execution. Click on the Copy icon allows you to copy the ID. |
Status | The Status of the execution, including Success, Failed, Rerun, Aborted, etc. |
Created At | The execution creation date. |
Started At | The execution start date. |
Last Updated at | The execution last updated date. |
Duration | The time spent for the execution process. |
Created By | The avatar and email ID of the user who initiated the execution. |
Service | The service name and link of the execution. |
Function | The name of the function of the execution. |
Use the sort feature to view executions based on the field you want to prioritize.
Schema Based Search and Filter
Schema Search is an integral component of the CloudOps, providing users with the capability to refine and narrow down the displayed executions based on specific criteria. These filters offer a powerful tool for managing and exploring large information efficiently.
Search Criteria | Description | Conditions | Data Types |
|---|---|---|---|
| Filter executions based on the creation date |
| dd/mm/yyyy |
| Filter executions based on the execution ID. For example, |
| String |
| Filter executions based on the function name. |
| String |
| Filter executions based on the item ID. |
| String |
Model | Filter executions based on the model ID and name. For example, |
| String |
Pipeline ID, Name, Cycle, or Node | Filter executions based on the pipeline ID, name, cycle, and node. For example, |
| String |
Service | Filter executions based on the service ID, name, and instance. For example, |
| String |
Execution Status | Filter executions based on the execution's status, such as created, in-progress, failed, success, aborted, and rerun. |
| String |
Trigger ID | Filter executions based on the trigger ID. |
| String |
Updated Timestamp | Filter executions based on the last updated date. |
| dd/mm/yyyy |
Use the Calendar to filter executions by a specific timestamp. You can filter executions up to 90 days.
Executions - General Details
Click on an execution will display a right-side panel with the details of the selected execution, including general details, contexts (generated by pipeline or application), inputs and outputs. Also, it allows you to perform the following execution actions:
Copy Execution ID
Copy Service ID. Click on the Service Name allows you to view the Service Page.
Copy Project ID. Click on the Project Name allows you to view the project dashboard page.
Copy Pipeline ID
Copy Model ID
Copy Item ID
Executions created via Pipeline, Application, etc.
If the execution is created via pipeline, a Pipeline chip is displayed, otherwise it displays Application chip.
If the execution is related to Roberto service (train/evaluate/predict), add Predict, Evaluate, and Train chip.
View Execution Logs
Click on the View Execution Logs to view the logs tab, where you can see more details of the executions.
Open CloudOps from the left-side menu.
Select the Executions tab from the list.
Find the execution and click on the View Execution Logs after the Service column of the execution. It opens the Logs tab of the service page. To learn more, refer to the Logs article.
Also, you can click on the View Execution Logs from the General Details from right-side panel of the execution.
Rerun All Execution Cycle
Open CloudOps from the left-side menu.
Select the Executions tab from the list.
Click Rerun All Executions to rerun all the executions. A confirmation message is displayed.
Click Confirm to rerun all the executions.
Rerun an Execution Cycle
Open CloudOps from the left-side menu.
Select the Executions tab from the list.
Find the execution and click on the play icon after the Service column of the execution.