Overview
The Geographic Information System (GIS) Annotation Studio is designed to facilitate the annotation of geospatial data. This powerful tool enables you to create, manage, and share geospatial annotations with unprecedented ease and accuracy. You can annotate geographic regions, boundaries, points of interest, or any custom geospatial elements directly on their maps. The studio supports a wide range of geospatial data types and formats, providing users with the flexibility to work with their preferred data sources.
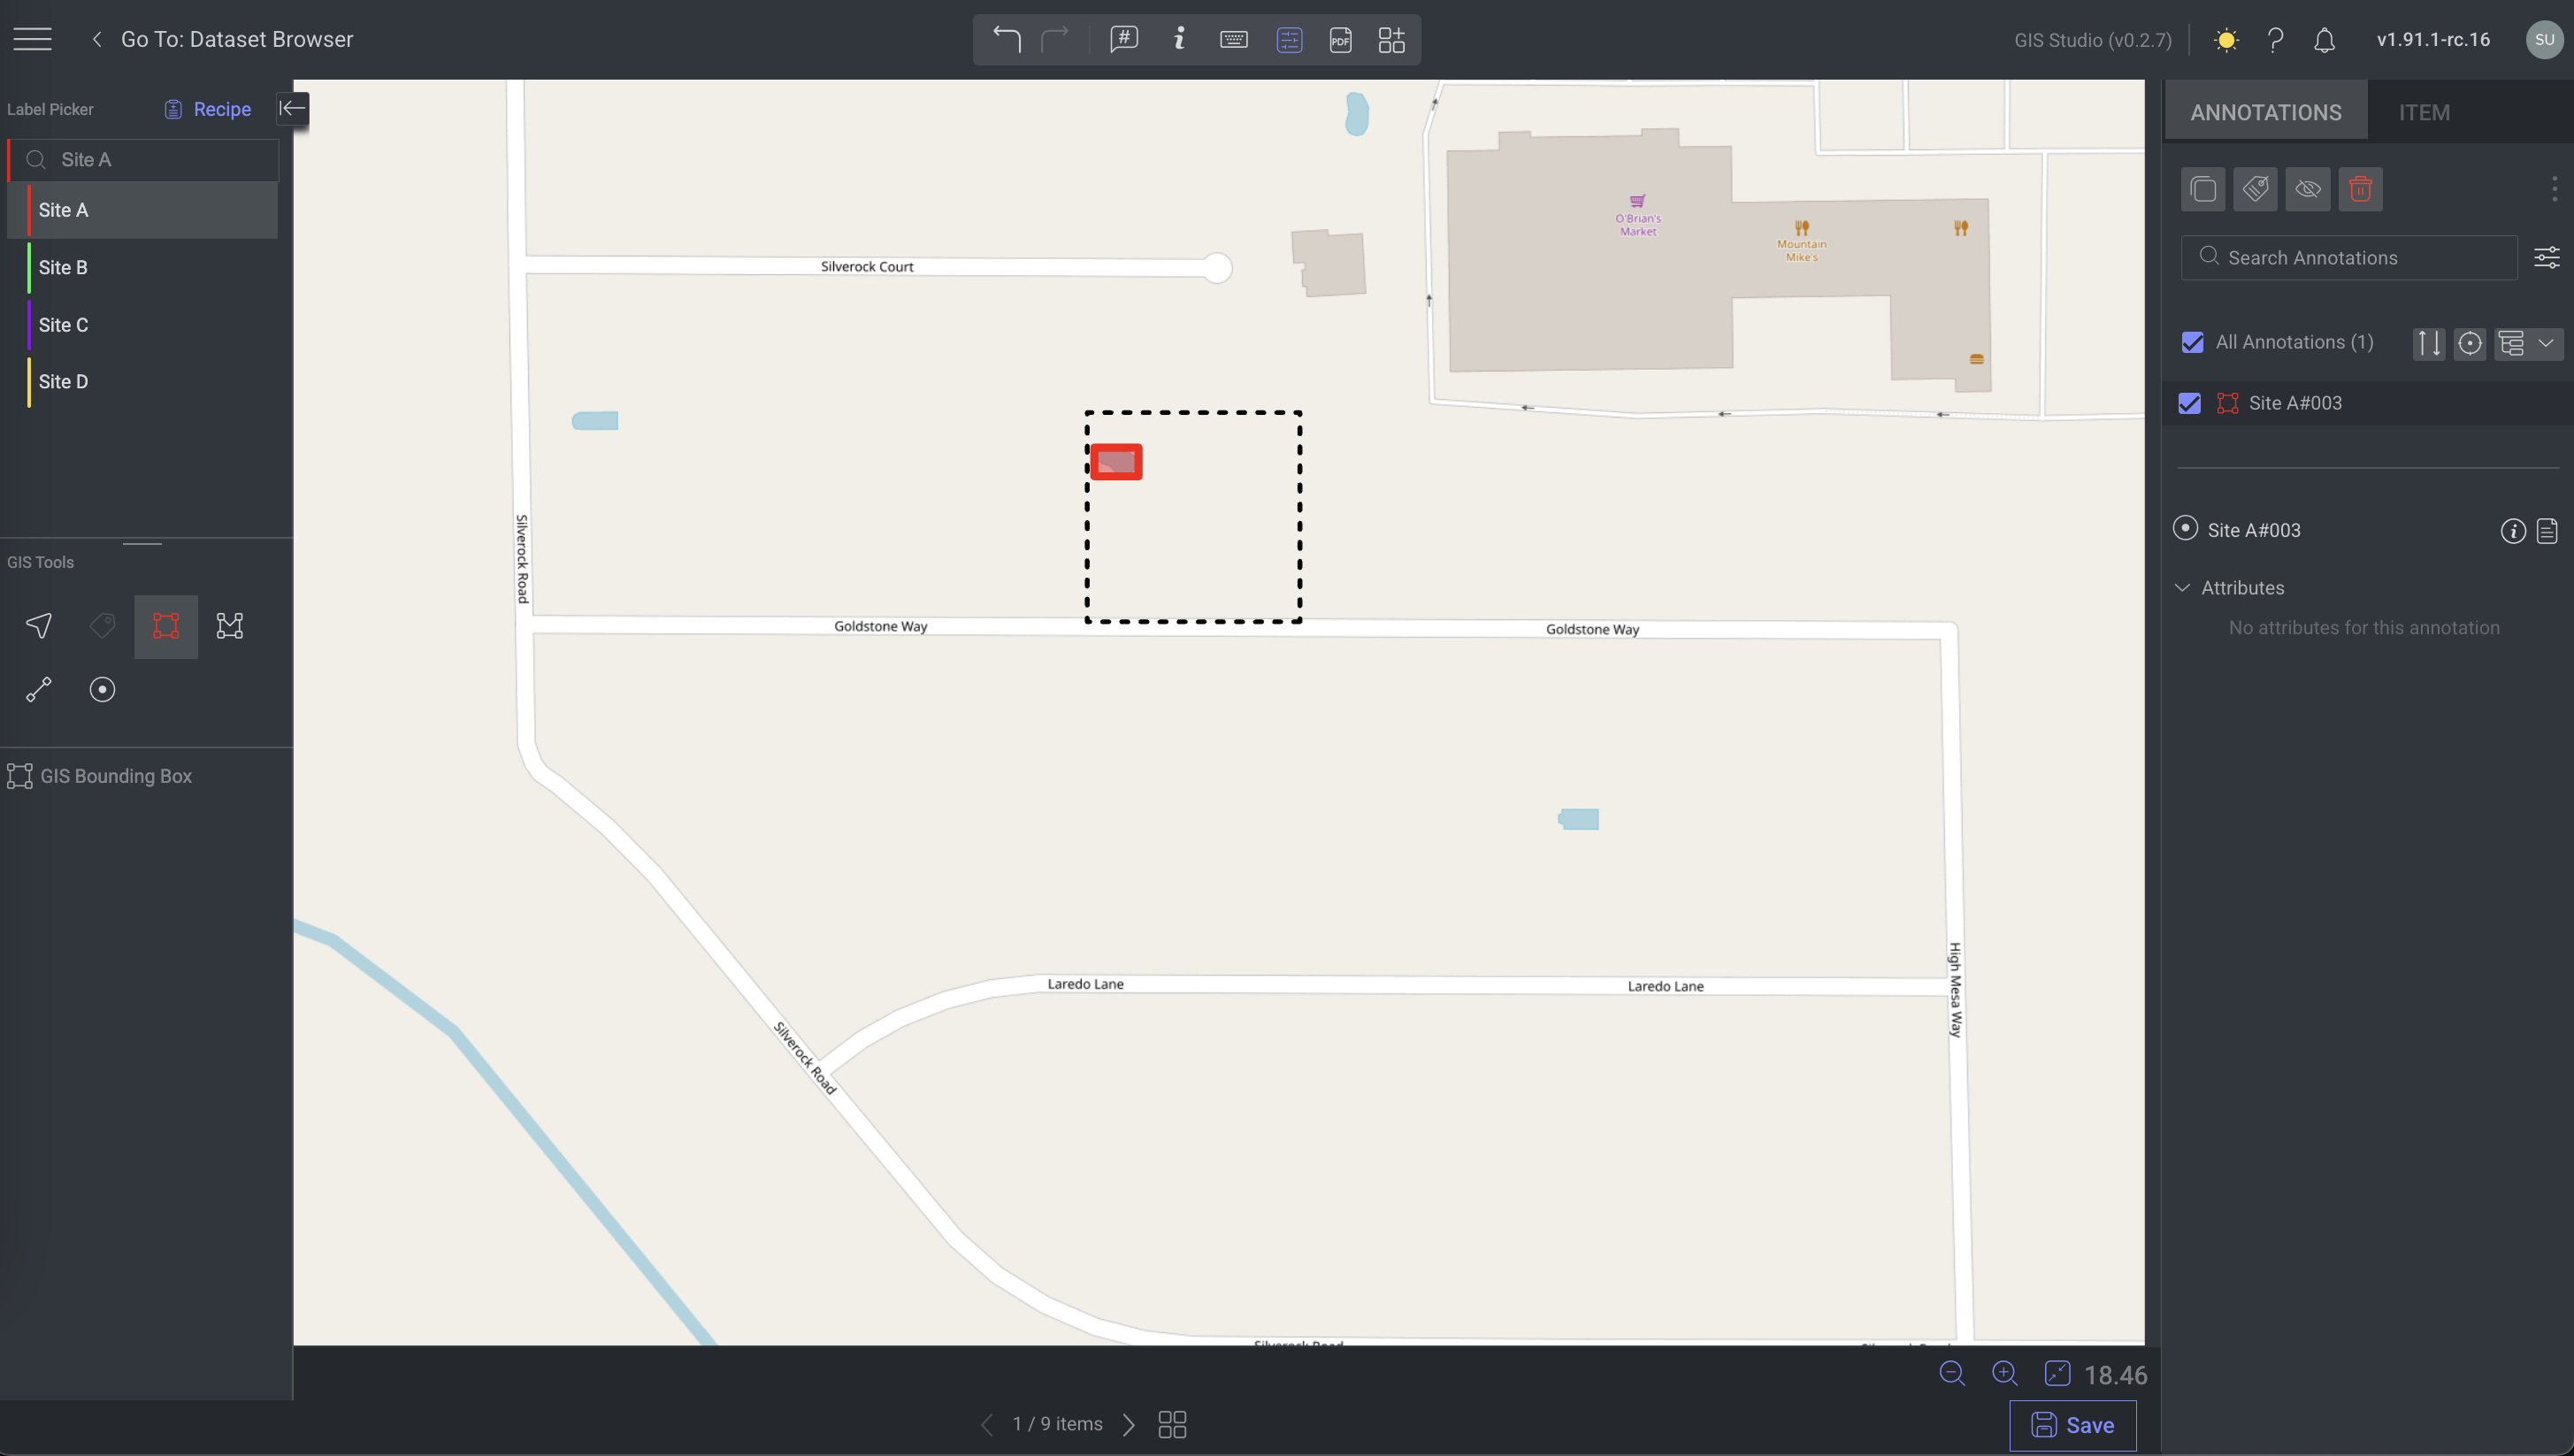
The GIS Annotation Studio includes a clearly defined Area of Interest (AOI), which serves as the designated workspace for creating annotations.
The Multi-Layer feature in Dataloop’s GIS Annotation Studio provides users with flexible control over map layers, enhances the annotation experience by providing precise control over layer visibility, arrangement, grouping, and transparency.
Upload GIS Items
In Dataloop's GIS Labeling Studio, you can upload and work with geospatial data using various supported file formats. This feature is designed to handle geospatial imagery and data, enabling efficient annotation, analysis, and management of GIS projects.
Users can upload GIS items and annotations through both the UI and the SDK:
Uploading via UI – Use the platform's interface to upload GIS items and annotations.
Uploading GIS Items via SDK – Utilize the SDK to programmatically upload GIS items.
Uploading GIS Annotations via SDK – Use the SDK to add GIS-specific annotations, such as bounding boxes, polygons, polylines, and points.
Upload GIS Items Using SDK
GIS items can be uploaded to Dataloop following the GIS-Item JSON format. When uploaded correctly, the item will display all associated metadata, including the Area of Interest if provided.
import dtlpy as dl

# Upload GIS item from a local file
gis_item = dl.ItemGis.from_local_file(filepath="item_path")
Upload GIS Annotations Using SDK
Dataloop SDK supports GIS-type annotations, which use latitude and longitude coordinates instead of pixel-based (x, y) values. Each geo-annotation follows a specific class structure.
Supported GIS Annotation Types
GIS Classification
Classification annotations for GIS items follow the same structure as standard classifications:
class GisClassification(label, attributes=None, description=None)
GIS Bounding Box
A bounding box is defined using latitude and longitude instead of x and y coordinates.
class GisBox(geo, label=None, attributes=None, description=None, angle=None)
geo: List of lat, long coordinates defining the bounding box.
angle (optional): Used for rotated boxes.
Box is created using two points (top-left and bottom-right):
[(left, top), (right, bottom)]
GIS Polygon
A polygon is defined using a list of latitude and longitude coordinates. The first and last coordinate must be identical to close the shape.
class GisPolygon(geo, label, attributes=None, description=None)GIS Polyline
A polyline is defined using a list of latitude and longitude points.
class GisPolyline(geo, label, attributes=None, description=None)geo: List of lat, long coordinates.
GIS Point
A point annotation is defined by a single latitude and longitude coordinate.
class GisPoint(lat, long, label, attributes=None, description=None)Example: Uploading GIS Annotations
Below is an example of adding various GIS annotation types using the SDK.
import dtlpy as dl

# Create GIS Box Annotation
box = dl.Gis(
    annotation_type=dl.GisType.BOX,
    geo=[
        [
            [-118.33545020696846, 33.82643304226775],
            [-118.33544677833854, 33.82643304226775],
            [-118.33544677833854, 33.826421352507026],
            [-118.33545020696846, 33.826421352507026],
            [-118.33545020696846, 33.82643304226775]
        ]
    ], label='car')

# Create GIS Polyline Annotation
polyline = dl.Gis(
    annotation_type=dl.GisType.POLYLINE,
    geo=[
        [-118.33542547032158, 33.82643633447882],
        [-118.33540897336161, 33.82643356752507],
        [-118.33540897005454, 33.82642871822452],
        [-118.33541921967488, 33.826426863335726],
        [-118.33542344940071, 33.826436077343644],
        [-118.33542639231051, 33.82643044674003],
        [-118.33541932625792, 33.8264323433901],
        [-118.33542031749415, 33.82644421336565],
        [-118.33542236477875, 33.82643168077253]
    ], label='car')

# Create GIS Point Annotation
point = dl.Gis(
    annotation_type=dl.GisType.POINT,
    geo=[-118.33540793707832, 33.82642046242373],
    label='car')

# Create GIS Polygon Annotation
polygon = dl.Gis(
    annotation_type=dl.GisType.POLYGON,
    geo=[
        [
            [-118.33543603201835, 33.82641747569975],
            [-118.33541563389792, 33.82641375053887],
            [-118.33542170322828, 33.82639922240139],
            [-118.33544032988657, 33.8264016410096]
        ]
    ], label='car')

# Attach Annotations to Item
builder = item.annotations.builder()
builder.add(annotation_definition=box)
builder.add(annotation_definition=point)
builder.add(annotation_definition=polyline)
builder.add(annotation_definition=polygon)
item.annotations.upload(annotations=builder)
Supported file formats
The GIS Labeling Studio supports the following file formats for geospatial data:
COG (Cloud-Optimized GeoTIFF):
A format for raster data, optimized for cloud storage and access.
Allows for efficient querying of specific regions within large geospatial datasets.
GeoTIFF:
A standard format for geospatial raster data.
Includes geographic metadata such as spatial resolution, coordinate systems, and projection details.
OSM (OpenStreetMap):
A vector-based format commonly used for open-source map data.
Includes roads, buildings, waterways, and other map features.
XYZ (Tile Map Services):
A format used for map tiles, typically in web mapping.
Represents geographic areas as tiled layers for zoomable maps.
GIS Studio Canvas
The GIS Studio Canvas provides a dynamic, organized, and user-friendly platform for handling complex geospatial data, enabling precise annotation, multi-layer control, and seamless navigation. Here’s an overview of its key features:
Area of Interest (AOI)
The GIS Annotation Studio includes a clearly defined Area of Interest (AOI), which serves as the designated workspace for creating annotations. This area is specified in the GIS-Item JSON as a polygon, typically a 2D rectangle, within which all annotations must be created. If you attempt to place an annotation point outside the AOI, it will automatically adjust to the nearest border, ensuring all points stay within bounds.
To distinguish the AOI from regular annotations, it features:
A black, dashed border with no background color, clearly marking its perimeter.
Non-interactive properties: the AOI cannot be selected, modified, or moved.
A tooltip that reads “Area of Interest” when hovering over the border.
The AOI also sets the boundaries and default zoom levels within the GIS Annotation Studio. The map’s bounds and initial zoom level extend 10% beyond the AOI’s dimensions, providing context around the annotated region and making it easier to navigate within the area.
Layers Controller
The Layers controller feature in Dataloop’s GIS Annotation Studio provides you with flexible control over map layers, enhances the annotation experience by providing precise control over layer visibility, arrangement, grouping, and transparency. This feature includes:
Layer Control Module: Accessible via a new button in the top-center settings bar, this module allows you to manage and customize layers.
Layer Visibility: Each layer has an eye icon that can be clicked to toggle visibility. By default, all top-level layers are visible.
Base Layers Group: A dedicated group labeled “Base Layers” includes default layers provided by Dataloop, such as OpenStreetMap (with plans to add options like Google Maps in the future). Only one base layer can be selected at a time, indicated by a radio button.
Layer Arrangement: Layers are initially ordered based on the Item’s JSON configuration, with Base Layers positioned at the bottom. Users can rearrange layers, with changes reflected both in the module and on the canvas.
Group Management: Layers can be organized into groups (as defined in the Item’s JSON), which can be collapsed or expanded for easier navigation. The module displays each group name and individual layer name.
Opacity Control: A slider for each layer and layer group allows users to adjust opacity from 0% to 100%, with the default set at 100%, enabling custom visibility for each layer.
Zoom and Pan
The canvas supports zooming and panning, allowing users to focus on specific regions within the AOI. The default zoom level provides a 10% margin around the AOI to give context to the work area.
Bottom-right panel deliver the following functionalities:
Zoom control: Small steps using (+) and (-) buttons.
Fit to screen: Adjusts the map to ensure the entire Area of Interest (AOI) fits within the viewport.
Panning across the map can be done by pressing and holding the Space key and dragging, making it easy to explore different areas of the map.
Interactive Elements
The canvas reflects real-time changes from the layer control module and annotation adjustments, ensuring that any modifications are immediately visible. Tooltips, such as the “Area of Interest” label on the AOI boundary, help users identify and navigate elements within the canvas effectively.
Label Picker
A Label Picker is a feature within the GIS annotation studio that allows you to select labels to assign to specific objects or elements in the data being annotated. On the left panel, there is a Label Picker, where you can select predefined categories for annotation. The available labels are determined in the Recipe.
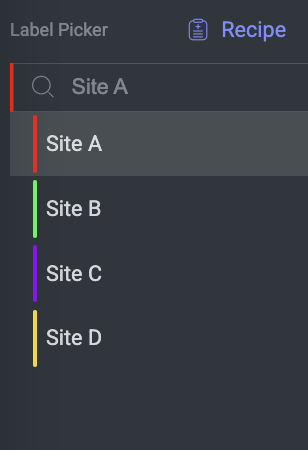
For example, Labels such as "Building," "Car," "Truck," "Tree," "Open Area", etc. are color-coded to help distinguish between different types of geospatial features. This feature allows users to quickly apply relevant labels to different areas or objects within the map.
You can perform the following activities on the Label Picker section:
Scroll and click a label to activate it.
Use the search bar to easily find labels.
Resize the label list to better fit your number of labels by clicking and dragging the separator line at the bottom.
GIS Tools
Below the Label Picker on the left-side panel, the GIS Tools section provides various tools for creating and editing annotations. The available tools are determined in the Recipe.
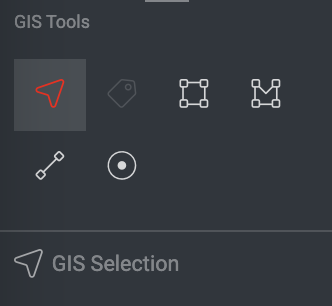
These tools include:
GIS Selection
It allows users to interact efficiently with existing annotations. Here’s how it works:
Selecting Annotations: Click to select an annotation, or Shift key + click to select multiple annotations.
Actions After Selecting:
Once selected, you can click and drag to move the annotation to a new position on the map.
Adjust dimensions, rotate, and use Ctrl + C / Ctrl + V to copy and paste.
Deselecting: Click outside the selected area to deselect all.
Map Navigation: Press Space + Click and Drag to pan across the map without altering selections.
Zooming: Shift + Drag to draw a zoom box around the area. When you release the mouse, the map zooms into the selected box.
GIS Classification
Below the Label Picker on the left-side panel, the GIS Classification tool enables item-level classification:
Create a classification by selecting the label; a labeled chip appears on the canvas.
Manage by clicking the chip to edit or using the X icon to delete.
GIS Bounding Box
Below the Label Picker on the left-side panel, the GIS Bounding Box tool in Dataloop's GIS Annotation Studio allows users to create rectangular annotations with ease. Here’s how it works:
Creating a Bounding Box Annotation:
Click to place the top-left corner, then a second click to set the bottom-right corner.
Hold Shift to create a square (width = height).
The box displays in the selected label color with a 20% opaque background.
After Creation:
Click to select the box, and click + drag points to adjust or reshape it.
Rotate the box: Select the box, then click and drag the circular dot in the top-left corner of the box to adjust the rotation as needed.
Navigation: Press the Space key to disable box creation temporarily, allowing you to pan across the map by clicking and dragging.
Polygon Tool
Below the Label Picker on the left-side panel, the GIS Polygon tool allows precise creation and editing of polygon annotations on geospatial data. Here’s how it works:
Creating a Polygon Annotation:
Click to add each point of the polygon, and double-click or click the first point to close the shape.
Hold Shift for free-hand point creation.
The polygon displays in the selected label color, with a 20% opacity background.
After Creation:
Click on the annotation in the right panel to select it.
Click + drag a point to move it, or add a new point to reshape the polygon.
Navigation: Press the Space key to disable polygon creation temporarily, allowing you to pan across the map by clicking and dragging.
Polyline Tool
Below the Label Picker on the left-side panel, the GIS Polyline tool in Dataloop's GIS Annotation Studio enables detailed line-based annotations. Here’s a quick overview:
Creating a Polyline:
Click to place each point along the line, and double-click to finish the polyline.
Press Shift for free-hand point creation.
The polyline appears in the selected label color for easy identification.
After Creation:
Click to select the annotation.
Hover near an existing point or line to preview edits, then click + drag to add or adjust points, creating new edges as needed.
Navigation: Press the Space key to pause polyline creation, allowing you to pan across the map by clicking and dragging.
Point Tool
Below the Label Picker on the left-side panel, the GIS Point tool in Dataloop's GIS Annotation Studio is used for marking single-point annotations on geospatial data. Here’s how it works:
Creating a Point Annotation:
Simply click on the map to place a point annotation.
The point will display in the assigned label color for easy identification.
After Creation: Click to select the point, and click + drag to reposition it as needed.
Navigation: Press the Space key to pause point creation, allowing you to pan across the map by clicking and dragging.
Annotations Tab
The Annotations tab on the right-panel allows you to control and manage annotations involves utilizing the annotations list and attribute controls, particularly when attributes are configured in the Recipe.
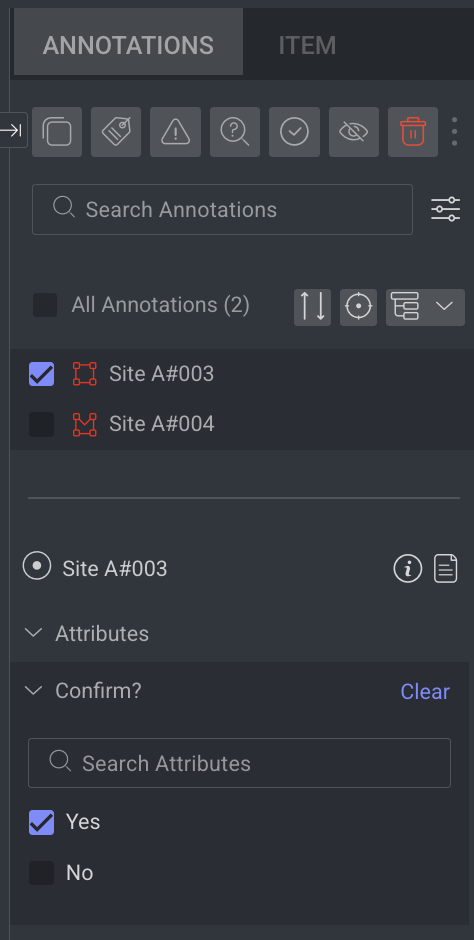
Learn more about the annotations and actions available.
Item Tab
The Item tab displays information according to the type of the selected item.
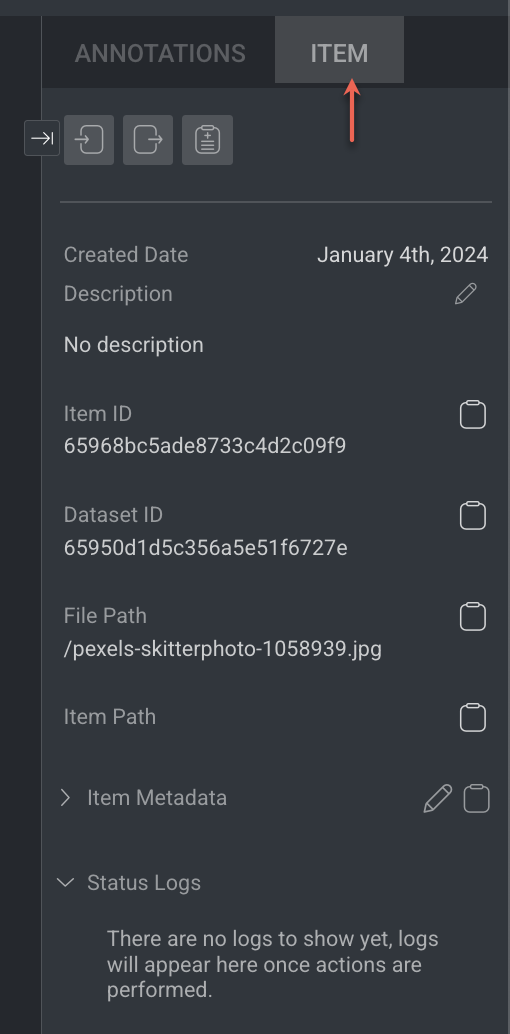
Learn more about the item and actions available.
Item Info & c=Controls (top-panel)
Item Info & Controls are available depends on the type of annotation studio. For the detailed information, refer to the following articles.

Keyboard shortcuts
General Shortcuts
Action | Keyboard Shortcuts |
|---|---|
Save | S |
Delete | Delete |
Undo | Ctrl + Z |
Redo | Ctrl + Y |
Zoom In/Out | Scroll |
Pan | Ctrl + Drag |
Navigate in label picker | Up or Down Arrows |
Select a label in the label Picker | Enter |
Tool Selection | 0-5 |
Previous Item | Left Arrow |
Next Item | Right Arrow |
Add Item Description | T |
Mark Item as Done | Shift + F |
Mark Item as Discarded | Shift + G |
Hide/Show Selected Annotations | H |
Hide/Show All Annotations | J |
Go to annotation list | Shift + ; |
Navigate in annotation list | Up and Down arrows |
Select/deselect an annotation | Space |
Tool Specific Shortcuts
Action | Keyboard Shortcuts |
|---|---|
Selector | 0 |
Classification | 1 |
Bounding Box | 2 |
Polygon | 3 |
Polyline | 4 |
Freehand Creating | Shift + Drag |
Item's View Controls (bottom-panel)
The controls on the bottom-side panel display based on the annotation contexts and work controls.

Workflow Context
Assignment controls, including moving between items, displaying the item gallery, and the status buttons (Complete / Discard). It displays only while working on an annotation or QA task.
Browse between the assignment items using the Left and Right arrows.
Open the Thumbnails' gallery viewer, and click a thumbnail to open that item.
Save button: Clicking the button when it is enabled triggers saving changes to the Dataloop platform, before the auto-saving feature takes care of that.
Status buttons: Complete and Discard.
View Controls
From left to right, work controls at the bottom panel.
Zoom control - Small steps using (+) and (-) buttons.
Fit to screen.
Work in the GIS Studio
Before you begin
Supported Data Types:
The GIS Studio supports a JSON file that contains references to the images.
Refer to the Supported Image formats section to view the supported image formats in the GIS Studio.
How to Upload Data?: Once the JSON file is ready, refer to the Upload Items article to upload the file into the Dataloop platform.
Prepare the Recipe:
Recipe Type - Legacy Recipe / Classic ML Recipe
Ensure you prepare the recipe as required to start the GIS Map annotation process.
For more actions: Refer to the Basic and general explanations and actions article to learn more about the available actions.
Access the GIS Studio
In the Data Browser, double-click on the JSON item or right-click -> Open With.
Select GIS Studio from the list. The selected item will be opened in the GIS Studio.
Use the bounding box tool
Select a Label from the Label Picker.
Select the GIS Bounding Box tool from the GIS Tools.
Click and drag the mouse button to the starting point of the area you want to annotate.
Drag the cursor to create a rectangle around the desired area, and release the mouse button to finalize the bounding box.
If required, move the bounding box by clicking on it and dragging.
Click Save to save the changes.
Use the polygon tool
Select the Label from the Label Picker.
Select the GIS Polygon tool from the GIS Tools.
Click on the starting point of the area to set the first vertex (corner) of the polygon.
Continue clicking to set additional vertices, creating the desired shape around the area you want to annotate.
To complete the polygon, click on the starting vertex.
If required, move the polygon by clicking on it and dragging.
Click Save to save the changes.
Use the polyline tool
Select the Label from the Label Picker.
Select the GIS Polyline tool from the GIS Tools.
Click on the starting point of the area to initiate the polyline by left-clicking with the mouse.
Identify the endpoint and double-click to define it. The polyline will be generated on the canvas and added to the list of annotations.
Use the point tool
Select the Label from the Label Picker.
Select the GIS Point tool from the GIS Tools.
Identify the object in the map and click on it. The newly created annotation is in the annotation list.
Export Annotations
In the GIS Annotations Studio, select the Item tab from the right-side panel.
Click Export icon.
Select the Export Annotation option from the list. A JSON file will be downloaded.
Important
In the GIS Labeling Studio, annotations are saved and exported in the EPSG:4326 format, ensuring coordinate data is stored using the standard latitude and longitude system (WGS 84) for precise geospatial referencing.
Export GIS Item
In the Data Browser, select the item.
Right-click -> File Actions -> Export JSON. A JSON file will be downloaded in a .zip file.
Change Annotation Labels
On the right-side panel, select the annotation from the annotations list.
Click on either the Change label & attributes icon from the top (above the Search Annotations field) or the Edit label icon (pencil icon) from the right-side of the annotation. A pop-up window is displayed.
Make sure you are on the labels tab, and select the desired new label to switch to.
Click Save Changes.
Note: Ensure that the updated label is displayed in both the annotation list and the interval time frame.
Set Attributes for an Annotation
On the Annotation list, click on the annotation name. A pop-up window is displayed.
Select the Attributes tab.
Set the attributes and click Save Changes.
Also, you can use the annotation list on the right-side panel, select the annotation, and follow the above steps to set the attributes.
Delete Annotations
Select the relevant annotation(s) from the annotation list.
Click Delete and confirm it.