Overview
The Logs tab displays records of services, executions, application installation processes (from initialization to completion), and more. Depending on your permissions, you can also view logs from other projects.
Real-time progress updates are now provided during service initialization, reflecting the environment installation status in the service logs. This offers greater transparency and a smoother setup experience.
Dataloop stores logs for a maximum of 14 days.
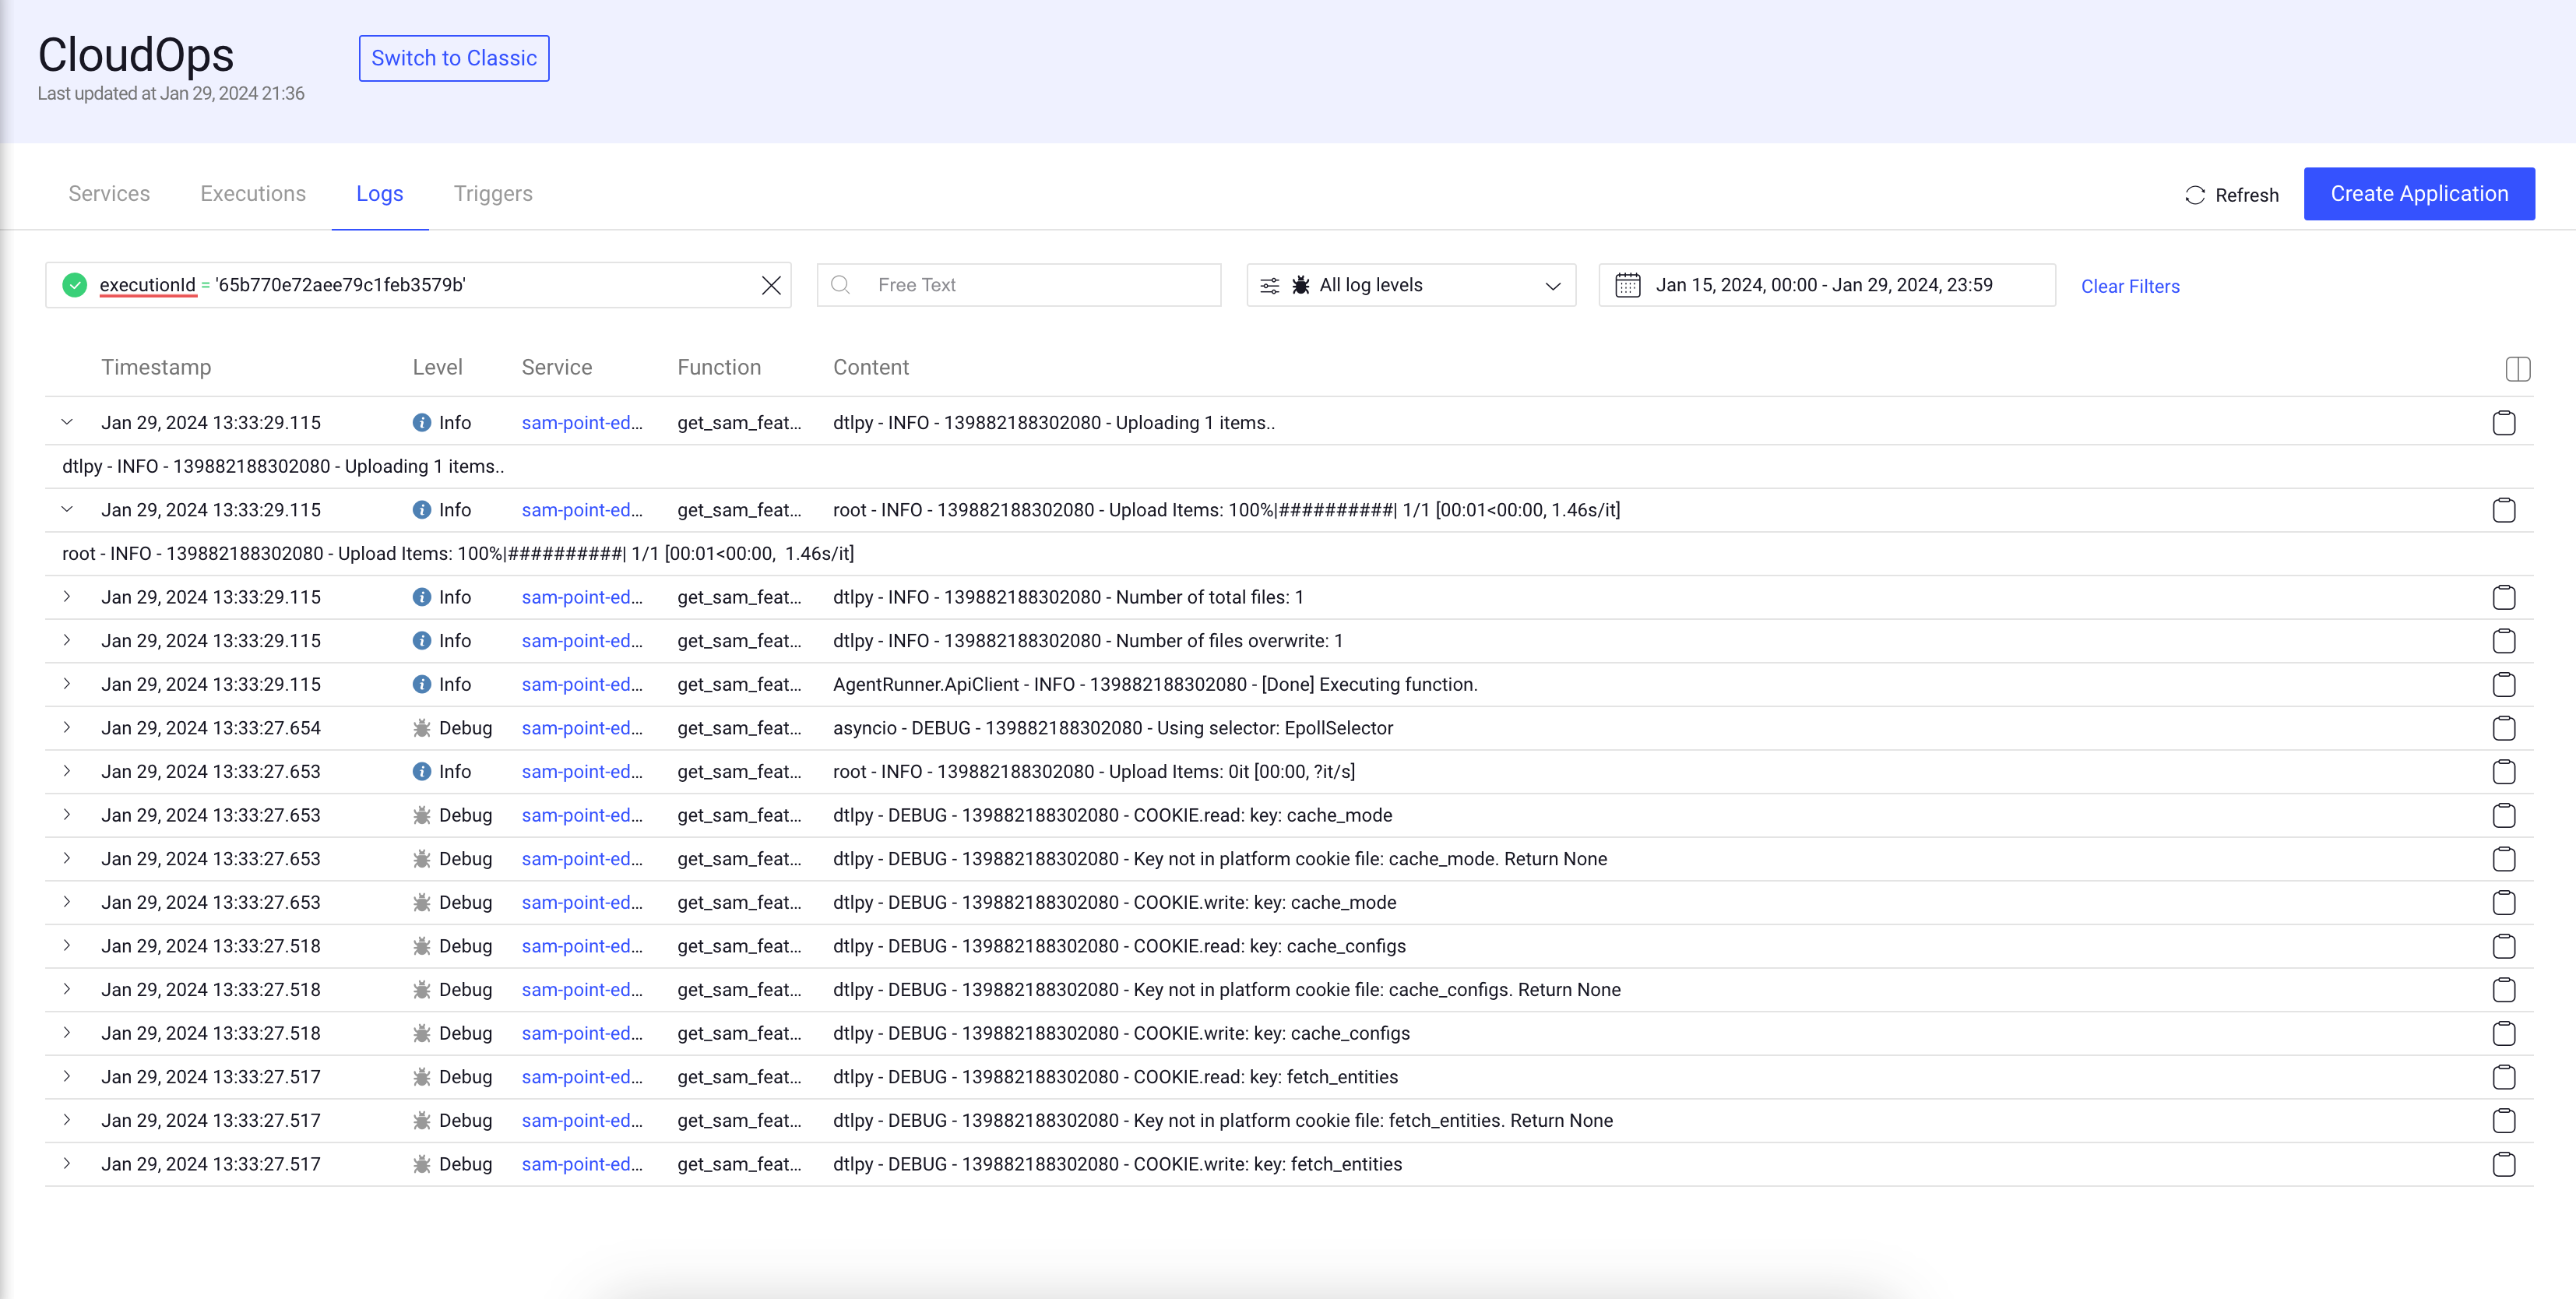
The list of logs shows the following column details:
| Fields | Description |
|---|---|
| Timestamp | The timestamp of the log creation. |
| Level | The level category of the log. |
| Service name | The name of the service. Click on the service name to open the service page. |
| Function Name | The name of the function of the service. |
| Content | The content details of the execution log. |
Click on the Copy icon on the log to copy the complete log data.
Schema Based Search and Filter
Schema Search is an integral component of the CloudOps, providing users with the capability to refine and narrow down the displayed logs based on specific criteria. These filters offer a powerful tool for managing and exploring large information efficiently.
Use the smart search field to search logs by:
| Search Criteria | Description | Conditions | Data Types |
|---|---|---|---|
| Execution ID | Filter logs based on the execution ID and name. | =, !=, IN, NOT-IN |
String |
| Function name | Filter logs based on the function name. | =, !=, IN, NOT-IN |
String |
| Item ID | Filter logs based on the item ID. | =, !=, IN, NOT-IN |
String |
| Model | Filter logs based on the model ID and name. | =, !=, IN, NOT-IN |
String |
| Pipeline ID, Name, Cycle, or Node | Filter logs based on the pipeline ID, name, cycle, and node. | =, !=, IN, NOT-IN |
String |
| Project | Filter logs based on the project ID and name. | =, !=, IN, NOT-IN |
String |
| Replica ID | Filter logs based on the replica ID. | =, !=, IN, NOT-IN |
String |
| Trigger ID | Filter logs based on the trigger ID. | =, !=, IN, NOT-IN |
String |
| Service ID and Name | Filter logs based on the service ID and name. | =, !=, >=, <=, <, > |
dd/mm/yyyy |
- Use free text to search logs.
- Use log levels to filter the logs including Critical, Error and higher, Warning and higher, Info and higher, and Debug and higher (all).
- Use the Calendar to filter logs by a specific timestamp.
- Click on the Copy icon to copy the log content in the JSON format.