Overview
Pipeline automation involves creating an end-to-end automated workflow that includes data ingestion, preprocessing, model training, evaluation, and prediction. The Model Nodes are essential components in this automated pipeline. Here’s a detailed look at how each Model Node functions within pipeline automation.
Mandatory Secrets & Integrations
A warning notification will be displayed to prompt the user to set an Integration and Secret if they have not been configured yet.
Predict Model Node
The Predict Model node in DDOE Pipelines automates annotation by using pre-trained or custom models (e.g., SAM, YOLO, ResNet). It identifies samples needing human review, speeds up annotation, and optimizes resources. Additionally, it enhances model performance through continuous learning and prepares data for honeypot or qualification tasks. Unlike applications, it manages computing settings automatically.

Set Integration or Secret
A notification with a link to set an integration or a secret will appear if not available in the node.
When you click on a Predict Model node, its details, such as Configuration, Executions, Logs, Instances, and available actions are shown on the right-side panel.
Node Name: By default, Predict Model is displayed as name. You can change it accordingly.
Model: Select a fixed model or variable for prediction. You can select a specific trained, pre-trained, or deployed fixed model version from the list or use a variable that can be updated during the pipeline execution.
Set Fixed Model: It allows you to set the selected model as a fixed model for prediction
Set Variable: It allows you to set a Pipeline Variable (follow from the Step 3).
Node Input: Input channels are set to be of type: item by default. Click Set Parameter to set input parameter for the Predict Model node. For more information, see the Node Inputs article.
To use the predict node, connect it to another node with the following inputs:
Item & annotation[]: Each predict node execution will initiate one execution of this node.
Item & annotation: Each predict node execution will initiate N executions of this node, according to the number of items in the annotation list. Each execution will run with an item-annotation pair.
Item/Annotation: Each predict node execution will initiate one execution of this node.
Annotation[]: Each predict node execution will initiate one execution of this node.
Node Output: Output channels are set to be of type: Annotation by default.
Trigger (Optional): An Event/Cron trigger can be set on this node, enabling you to initiate the pipeline run from this specific point.
When a node is selected, the Executions tab provides details about the execution of each item processed through that node.
- Choose a specific execution from the list to access its detailed information.
- Dataloop stores executions for a maximum of 90 days.
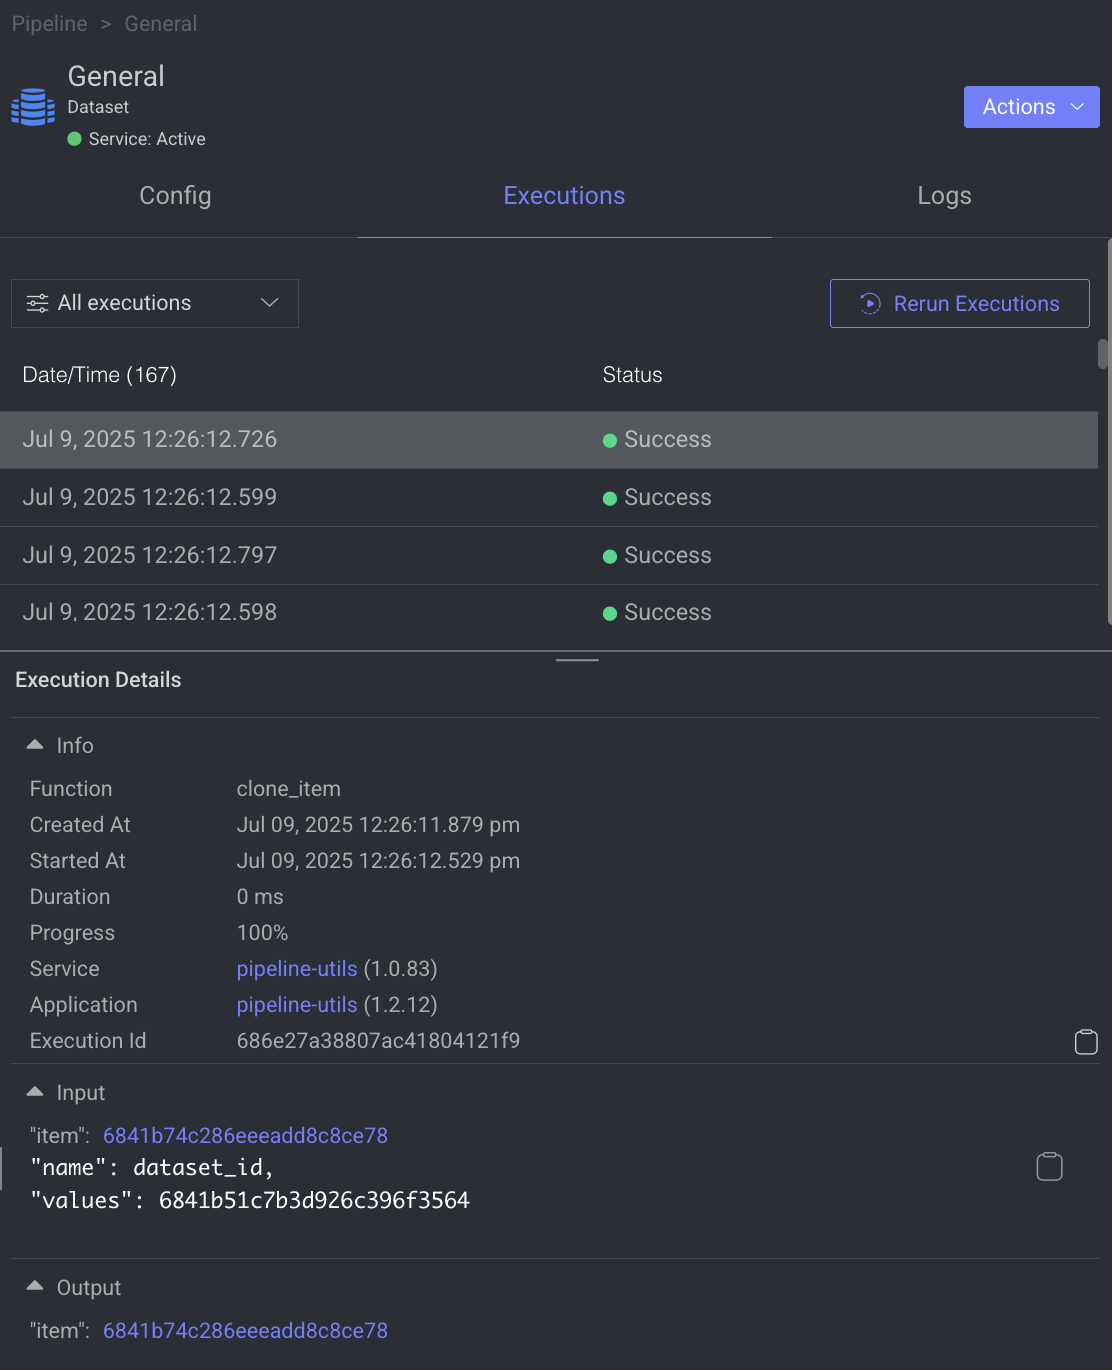
- Use the filter to display executions based on its status.
- Click Rerun Executions to rerun the selected executions. Before you confirm the rerun, you have two actions for the cycles:
- Resume Cycle: Resume the cycles of the selected executions starting from the current node onwards.
- Restart Cycle: Restart the cycles of the selected executions starting from the beginning.
- View Execution details such as Information, Input, and Output.
The Logs tab provides a granular view of what happens behind the scenes when a node executes.
- It showcases all log entries, including function and service level logs, application installation processes (from initialization to completion), generated during executions of the corresponding node within the selected time-frame.
- Dataloop stores logs for a maximum of 14 days.
- Click on the log to view log details in the bottom.
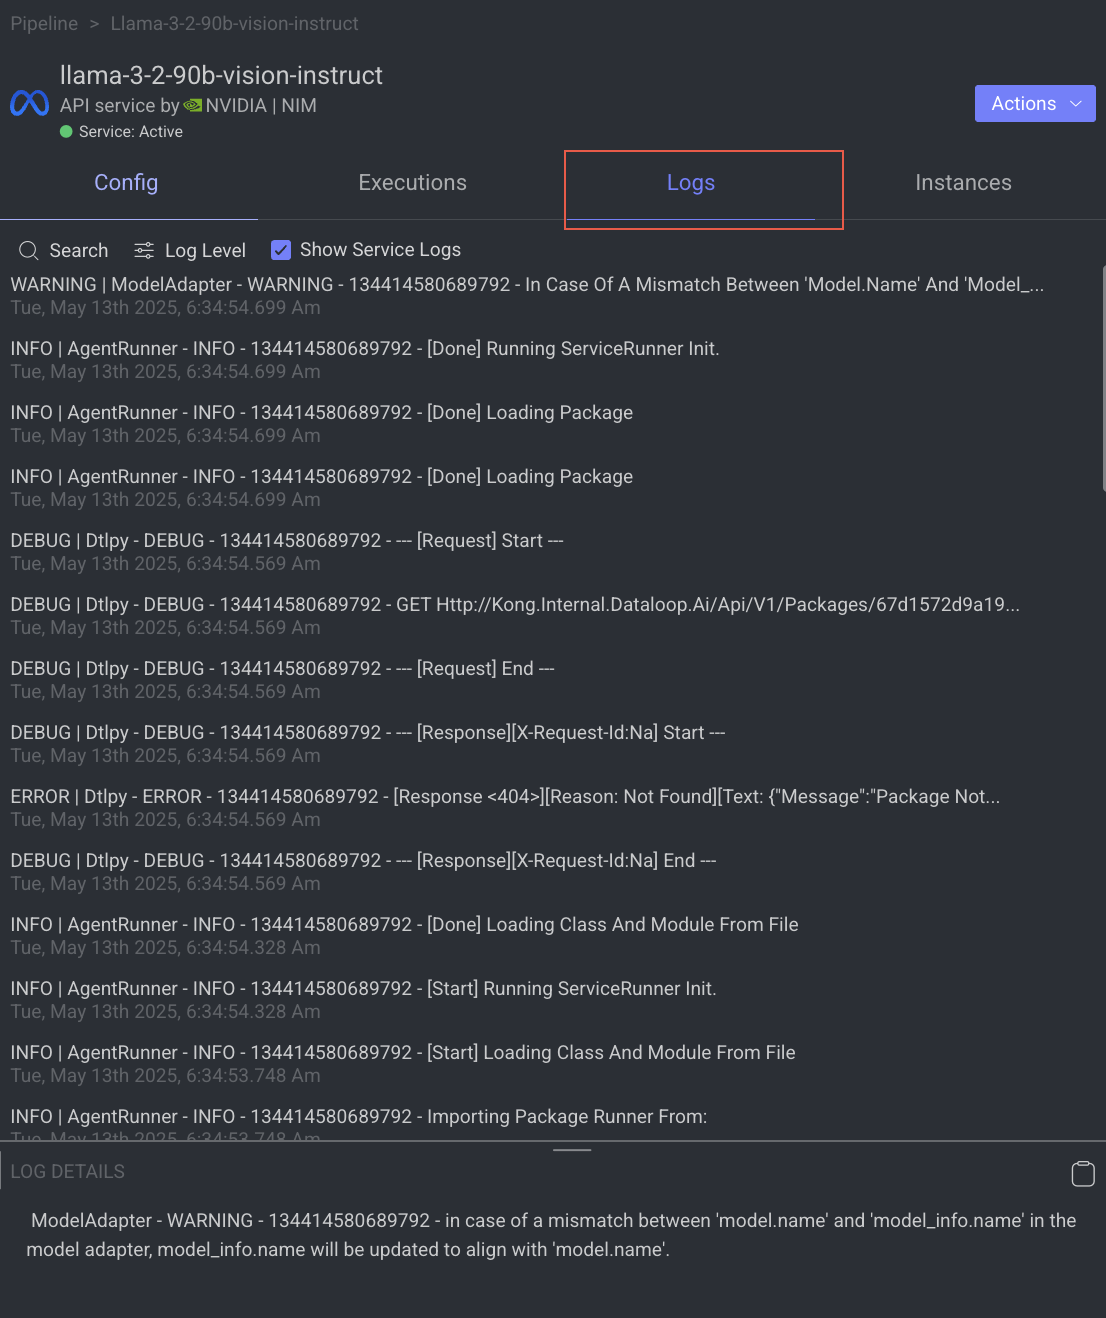
Utilize the following options to navigate through the logs:
- Search: Enter free text to search through the logs.
- Log Level Filter: Filter logs by selecting a level (critical, error, warning, info, debug) to find logs at that level and above.
- Show Service Logs: Show/hide service-level logs, aiding in the debugging and resolution of service-level errors and issues.
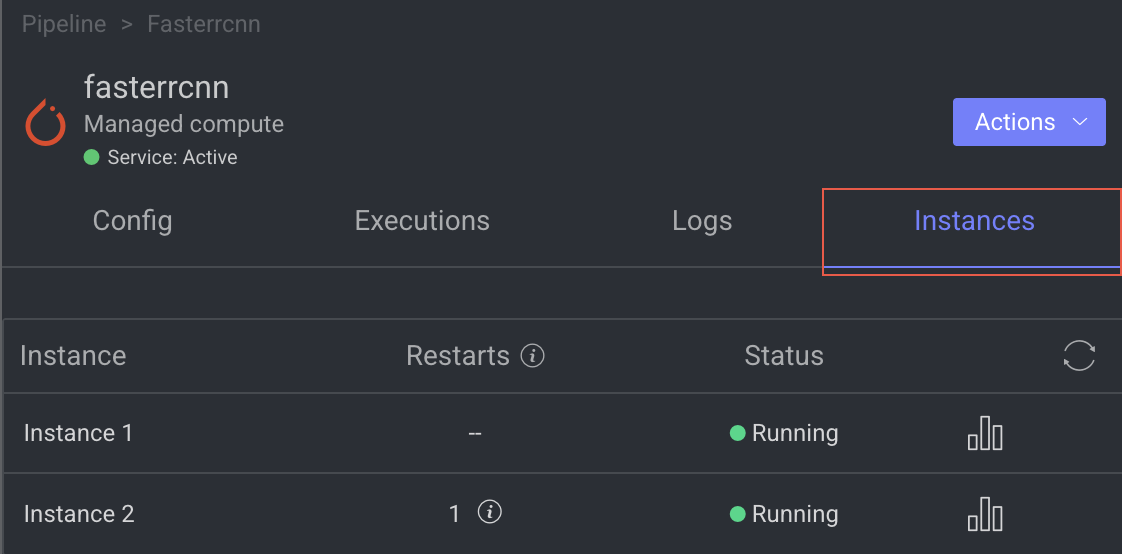
The Instance tab displays all available instances (replicas of services or machines) of the node service, along with their current status—such as 🟡 Initializing, 🟢 Running, or 🔴 Failed.
- It also indicates the number of restarts for each instance, which is useful for identifying services that are failing to activate and continuously restarting.
- Additionally, a monitoring icon is available for each instance. Clicking this icon redirects you to the Instances section of the Service page, where you can monitor detailed health metrics such as CPU and memory usage for each instance.
Predict node allows you to perform the following actions:

Open the Service Page
Open the service page of a pipeline node where you can see Monitoring, Executions, Logs, Triggers, and Instances information of the service. It will be available once you set a model.
- Open the Pipelines page and click on the pipeline from the list.
- Select the node from the pipeline.
- Click on the Action from the right-side panel.
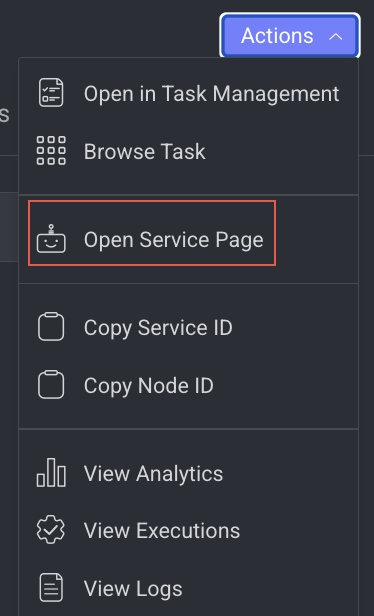
- Click Open Service Page from the list. The Monitoring tab of the service page is displayed.
Open the Model Page
It allows you to open the model that has been referenced. It will be unavailable if there is no model reference.
- Open the Pipelines page and click on the pipeline from the list.
- Select the node from the pipeline.
- Click on the Action from the right-side panel.
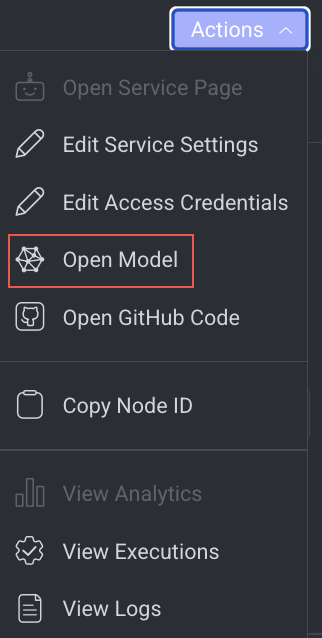
- Click Open Model from the list. The Model's Details page is displayed.
Open GitHub Code
It allows you to open the GitHub Code reference for the selected model. It will be unavailable if there is no fixed model selected.
- Open the Pipelines page and click on the pipeline from the list.
- Select the node from the pipeline.
- Click on the Action from the right-side panel.
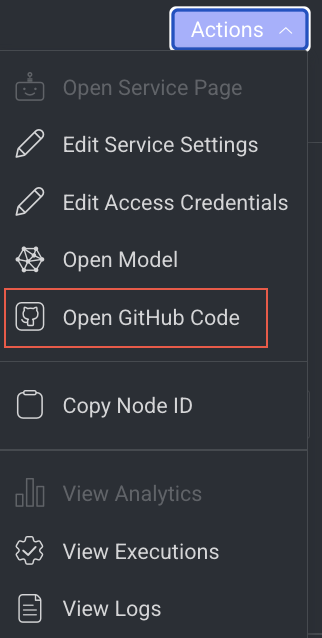
- Click Open GitHub Code from the list. The GitHub page of the selected model is displayed.
Edit Service Settings
It allows you to make changes to the service settings like Integrations, Service Configuration, and Execution Configuration based on the model you have selected. This option is not available for Train and Validation.
You can now edit the service configuration of a node even while running a pipeline, providing greater flexibility.
- Open the Pipelines page and click on the pipeline from the list.
- Select the node from the pipeline.
- Click on the Action from the right-side panel.
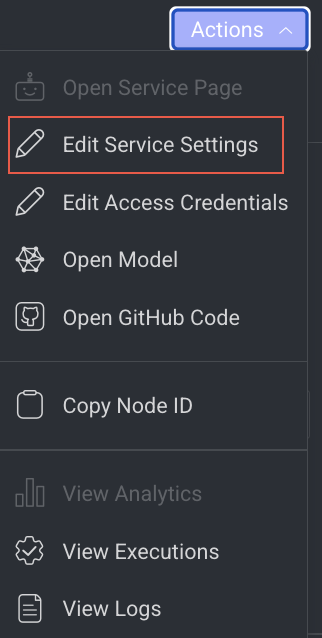
- Click Edit Service Settings from the list. The Edit Service Setting popup window of the service is displayed.
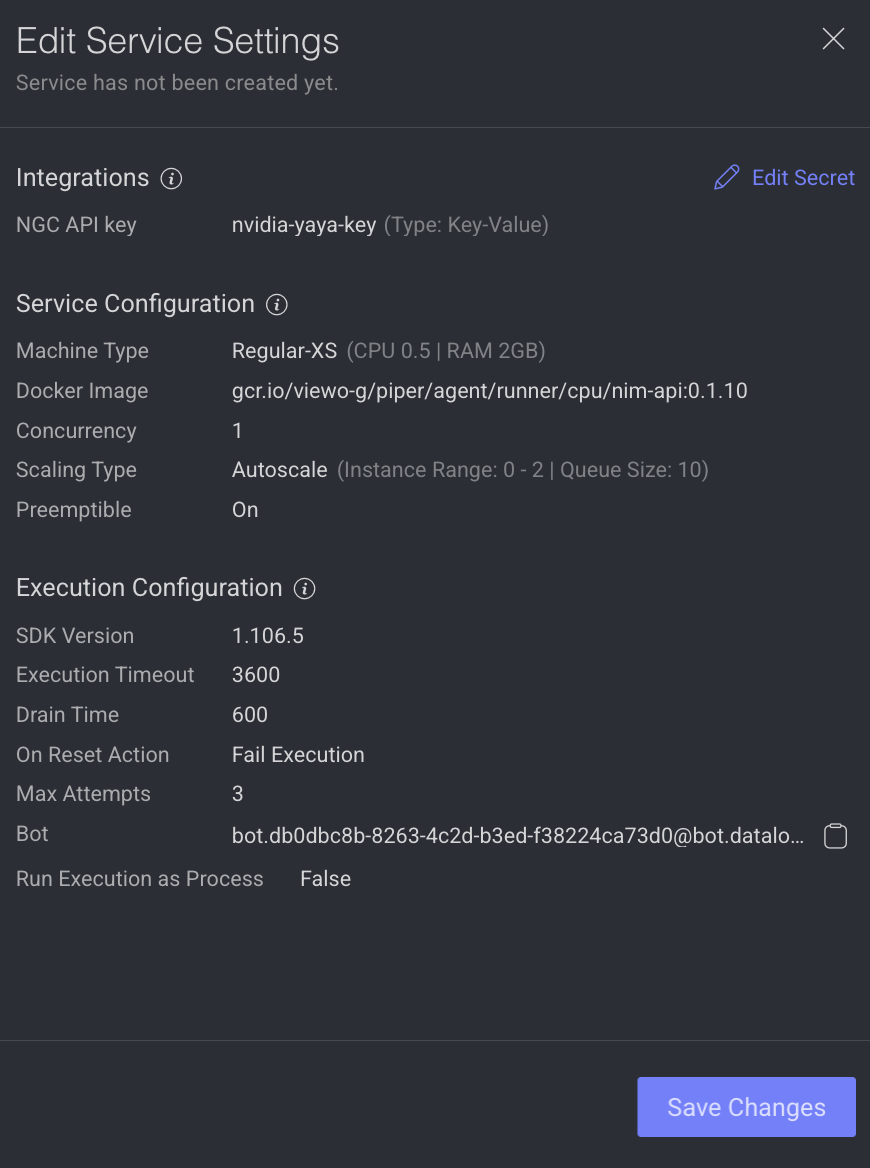
Integrations
The secret values are displayed, if the secret is defined in the dpk/dpkConfig. Click on the Edit Secret to search and select a secret from the list.
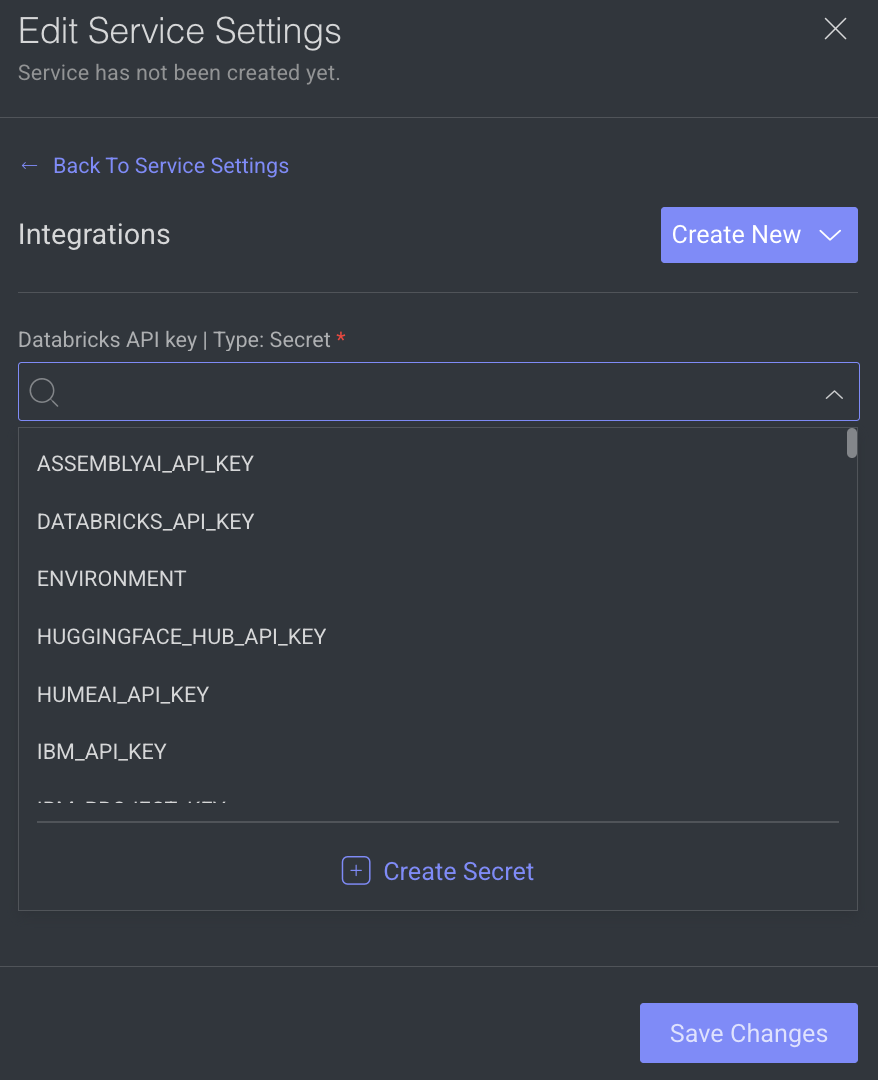
- To create a new secret, click Create New -> Create Secret.
- To create a new Integration, click Create New -> Create Integration.
- Click Save Changes, if no additional modifications are needed.
Service Configuration
The service configuration section allows making changes to the following parameters, to change, click on the Edit Configuration.
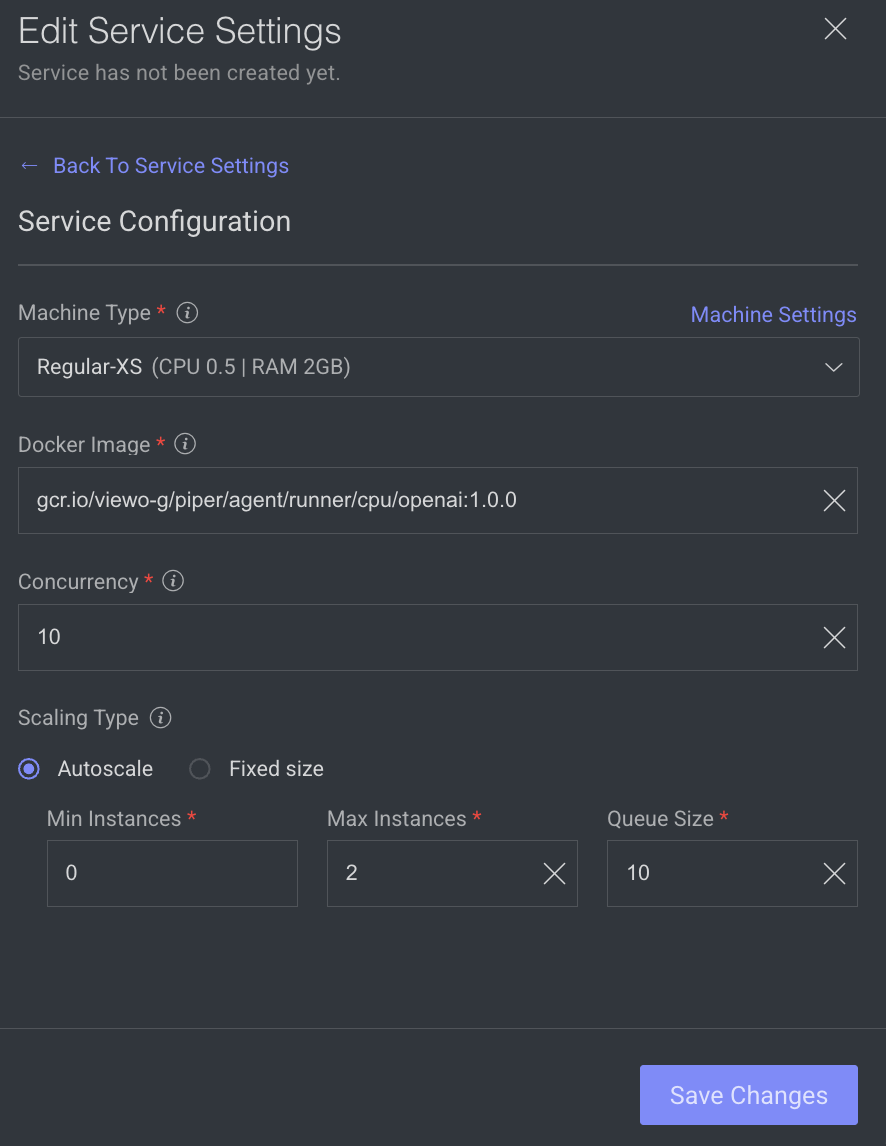
- Machine Types: The machine type on which the service will run (refers to CPU, GPU, RAM).
- Change the machine type from the list.
- Click on the Machine Settings to enable Preemptible Machine, the reclaimable compute instances.
- Docker Image: A container image encapsulating essential dependencies and code for service execution. By default, the docker image based on the SDK version is displayed. You can modify the URL as required.
- Concurrency: Number of concurrent executions per instance. By default, the value 10 is displayed.
- Scaling Type: Choose the scaling type based on your workload.
- Autoscale: Recommended by default. Autoscaling dynamically adjusts the number of service instances based on the incoming execution load, suitable for changing workloads. When autoscaler reduces instances, it waits for execution timeout before termination.
Min Instances: By default, 0. If you set the min instances to 0, the service will not run until it has something in the queue, it will be suspended.Max Instances: By Default, 2.Queue Size: By default, 10.
- Fixed size: Use fixed scaling when you need a predetermined number of service instances, suitable for consistent workloads. Compute hours counts also when there is no workload. By default, 1 instance is selected.
- Autoscale: Recommended by default. Autoscaling dynamically adjusts the number of service instances based on the incoming execution load, suitable for changing workloads. When autoscaler reduces instances, it waits for execution timeout before termination.
- Click Save Changes, if no additional modifications are needed.
Execution Configuration
The execution configuration section allows making changes to the following parameters, to change, click on the Edit Configuration.
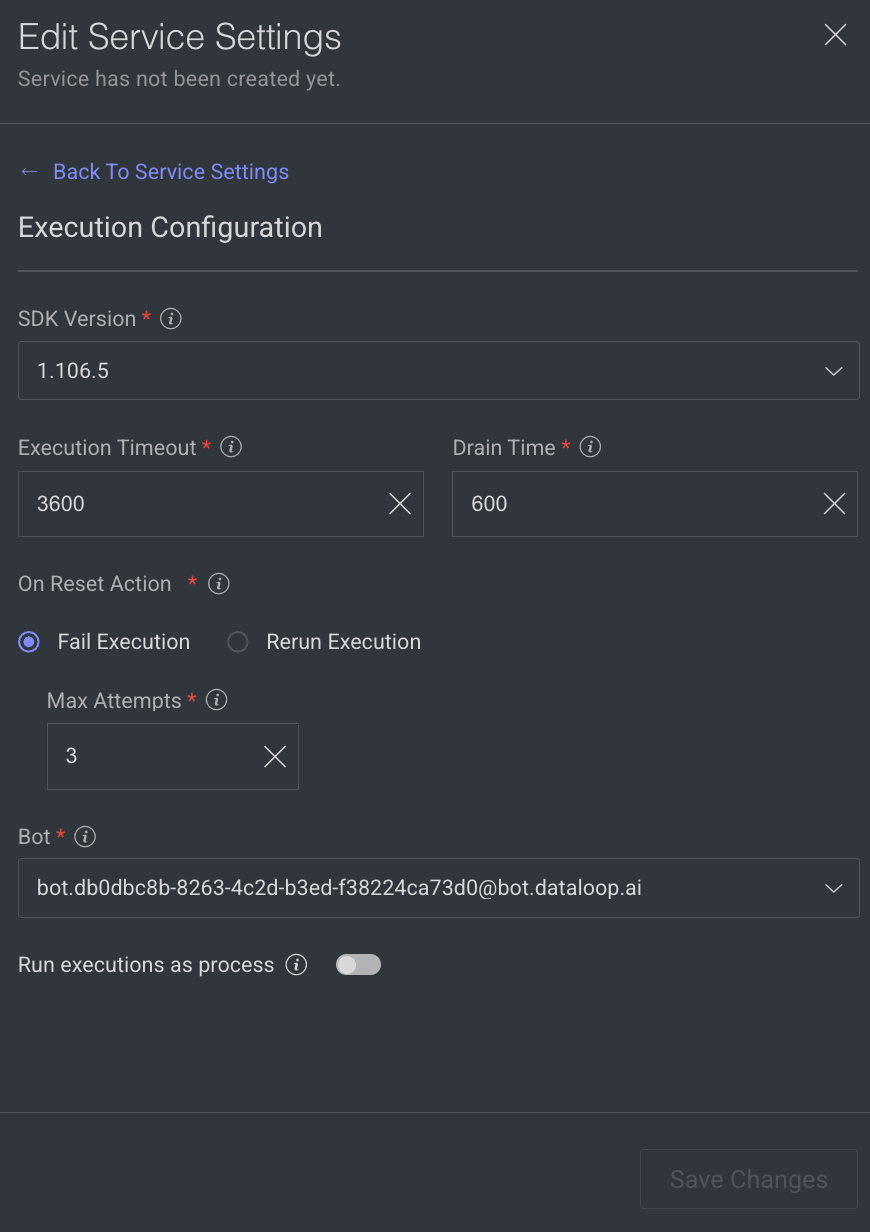
- SDK Version: The SDK version is displayed. Click to select a new version from the list.
- Execution Timeout: The maximum execution duration before service restarts (in seconds). By default, 3600 is displayed.
Drain Time: Delays service restart to complete ongoing executions (in seconds). By default, 600 is displayed.On Reset Action: Action taken when a service is reset or restarted (e.g. timeout). Select one of the following when you reset the execution.- Fail Execution
- Rerun Execution
Max Attempts: Configures to automatically retry failed executions up to x attempts. Maximum number of execution attempts allowed. By default, 3 is displayed.- Bot: A dummy user used for running the service ('developer' role). A default Bot is displayed. Select a new one from the list, if needed.
Rerun executions as process: Defines if each execution will start a new thread or a process. Enable to make the execution as a process.- Click Save Changes.
Edit Access Credentials
You can edit access credentials for models to easily select API keys for seamless application integration.
- Open the Pipelines page and click on the pipeline from the list.
- Select a model node from the pipeline.
- Click on the Action from the right-side panel.
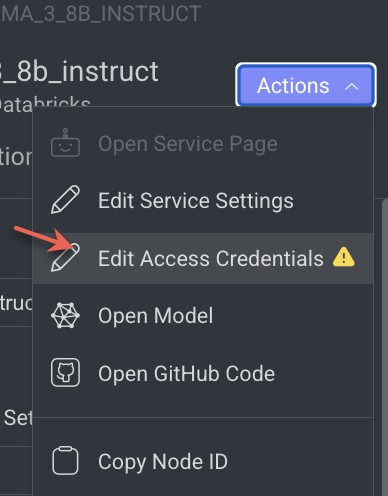
- Click Edit Access Credentials from the list. The Set Credentials popup window is displayed.
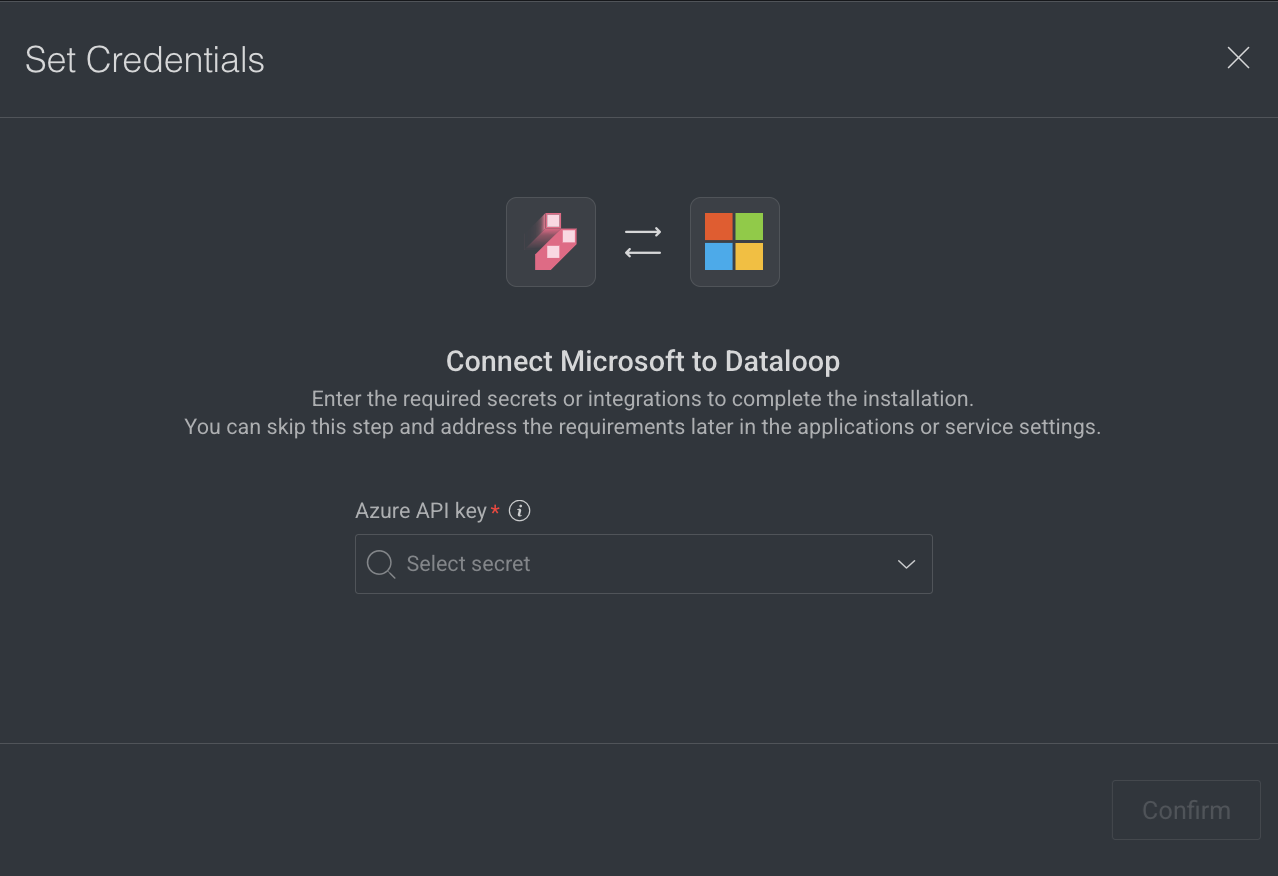
- Select the API Key from the list.
- Click Confirm.
Copy the Node ID
Copy node ID of a pipeline node
- Open the Pipelines page and click on the pipeline from the list.
- Select the node from the pipeline.
- Click on the Action from the right-side panel.
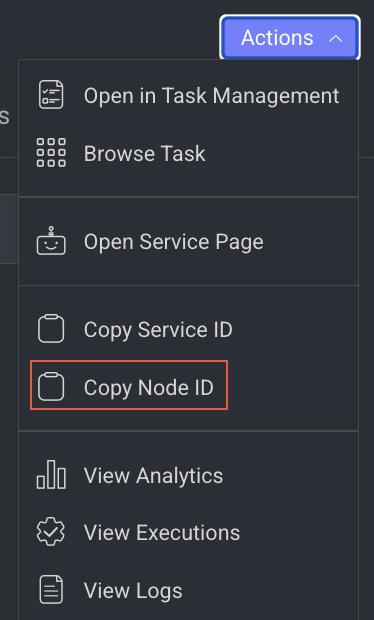
- Click Copy Node ID from the list.
View Execution Details
It allows you to view the Executions page of the Application Service.
- Open the Pipelines page and click on the pipeline from the list.
- Select the node from the pipeline.
- Click on the Action from the right-side panel.
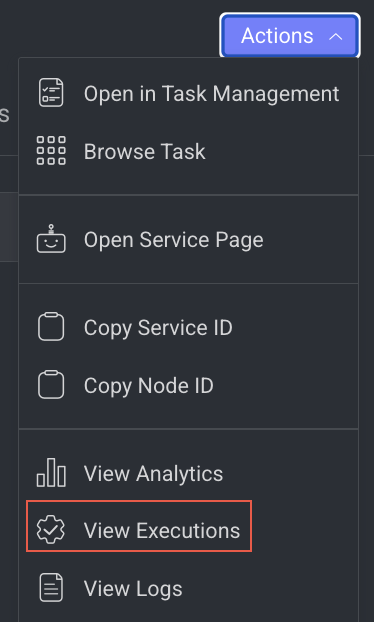
- Click View Executions from the list. The Executions tab of the CloudOps Service page is displayed.
View Analytics Details
It allows you to view the Monitoring tab of the Application Service.
- Open the Pipelines page and click on the pipeline from the list.
- Select the node from the pipeline.
- Click on the Action from the right-side panel.
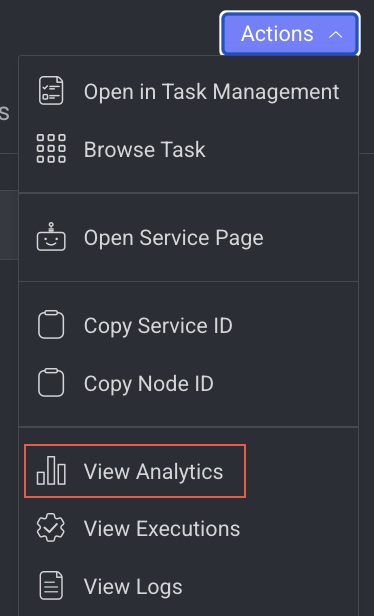
- Click View Analytics from the list. The Monitoring tab of the Application Service page is displayed.
View Log Details
It allows you to view the Logs page of the Application Service from a pipeline node.
- Open the Pipelines page and click on the pipeline from the list.
- Select the node from the pipeline.
- Click on the Action from the right-side panel.
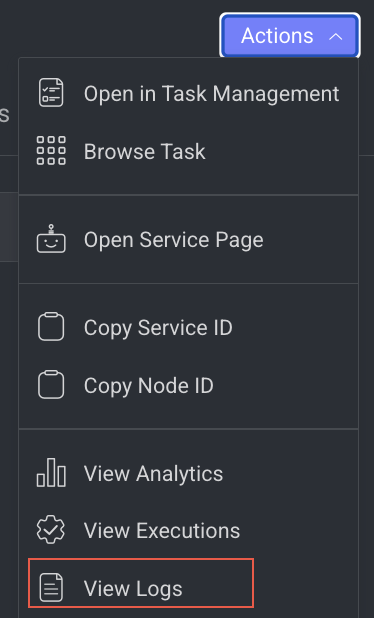
- Click View Logs from the list. The Logs tab of the CloudOps page is displayed.
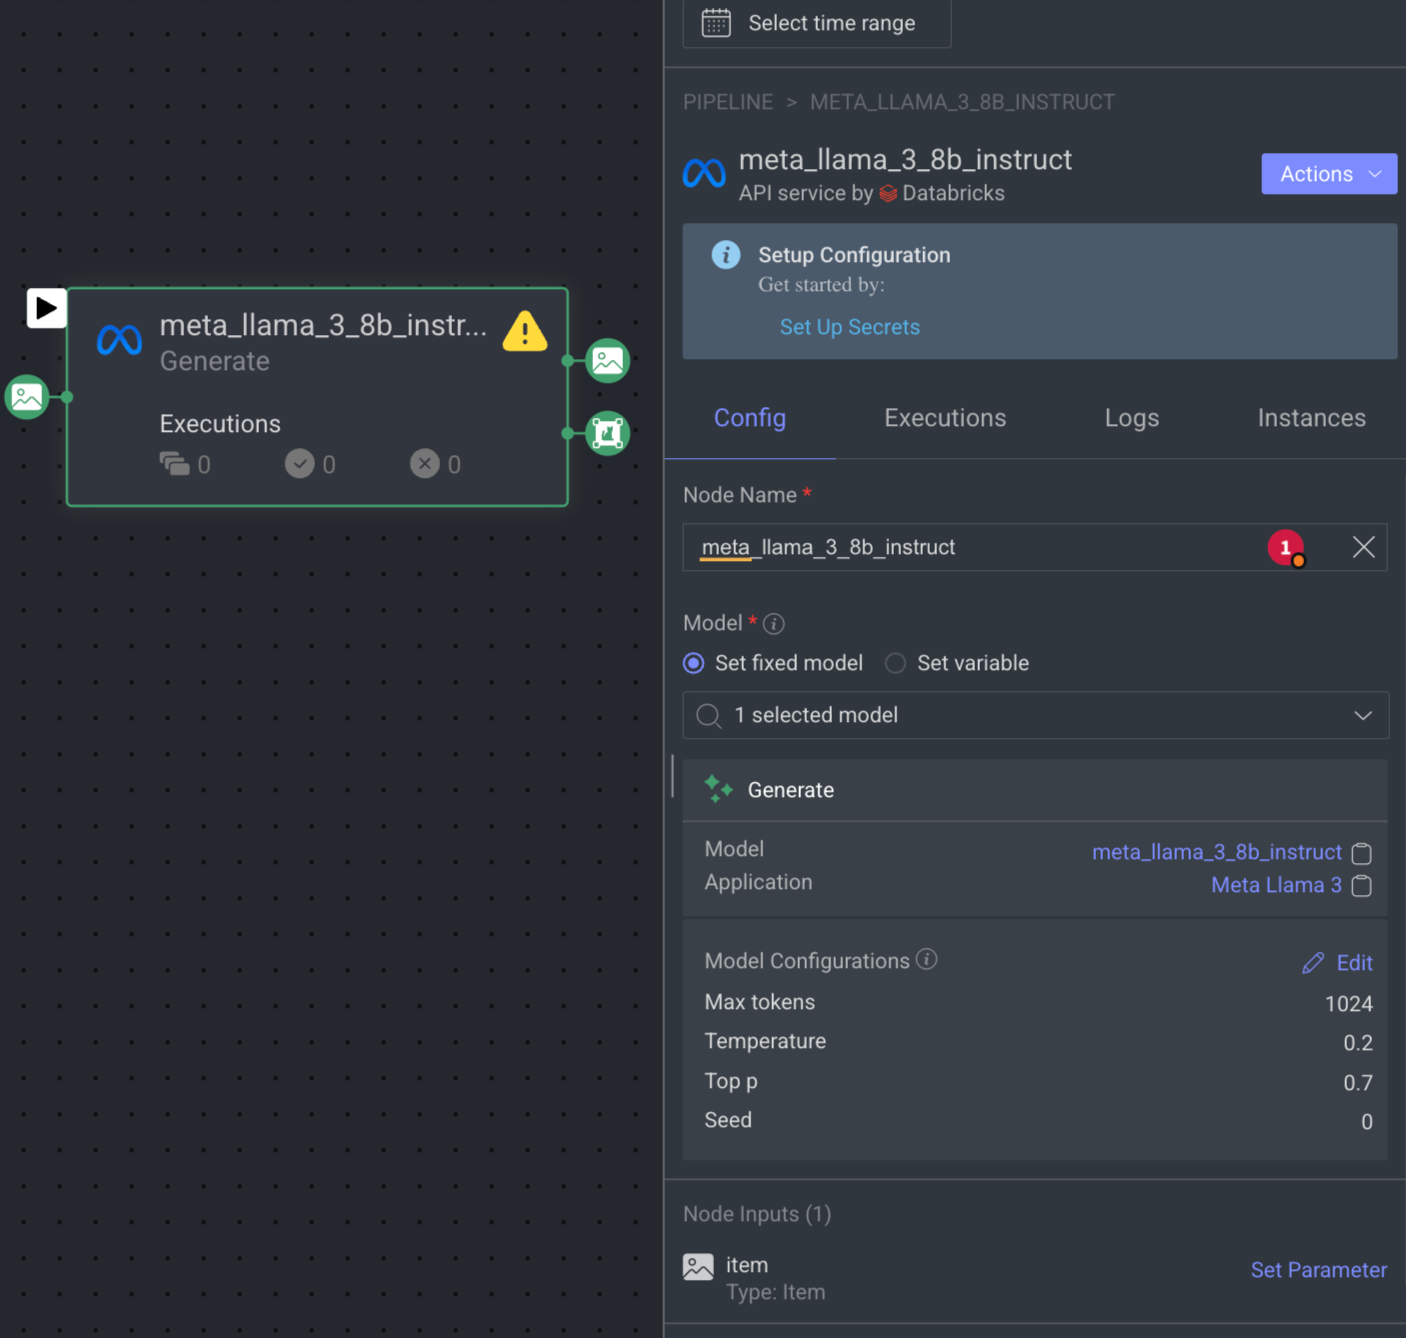
Generate Model Node
The Generate Model node integrates a generative AI model into your pipeline. It processes a prompt item to generate a response, returning the result as an annotation. You can customize settings such as system prompt, max tokens, temperature, and more directly from the node configuration.
When you click on the Generate node, its details, such as Configuration, Executions, Logs, Instances, and available Actions are shown on the right-side panel.
Set Integration or Secret
A notification with a link to set an integration or a secret will appear if not available in the node.
The Generate model node details are presented in four tabs as follows:
Node Name: By default, Generate is displayed as name. You can change it if required.
Model: Select a Generate model from the list, either Set a fixed model or Set variable (Type: model) that can be updated dynamically during pipeline execution. If there is no model available, click on the Install Foundation Model link to install it from the Marketplace. Also, you can click on the model and application name to view more information.
Model Configuration: You can easily adjust the model's configuration directly from the node settings, including options like:
System prompt: The system prompt provides context or sets the tone for the model's responses. It acts as an initial instruction or guidance that influences how the model generates its output. Click Edit to make changes in the System Prompt.
Max tokens: It controls the maximum number of tokens (words or word pieces) the model can generate in response to a given prompt. By default, 1024 is displayed.
Temperature: It controls the randomness of the model's output. It influences how creative or conservative the generated text will be. The default temperature is set to 0.5, which strikes a balance between deterministic and random output. A lower temperature (closer to 0) makes the model more focused and deterministic, often generating more predictable responses. A higher temperature (closer to 1) increases randomness, leading to more diverse and creative responses.
Additional Parameters: Click Edit to make changes in the model configuration parameters.
Input: By default, Type: Item is selected.
Output: By default, Type: Item and Annotations are available.
Trigger (Optional): An Event/Cron trigger can be set on this node, enabling you to initiate the pipeline run from this specific point.
When a node is selected, the Executions tab provides details about the execution of each item processed through that node.
- Choose a specific execution from the list to access its detailed information.
- Dataloop stores executions for a maximum of 90 days.
- Use the filter to display executions based on its status.
- Click Rerun Executions to rerun the selected executions. Before you confirm the rerun, you have two actions for the cycles:
- Resume Cycle: Resume the cycles of the selected executions starting from the current node onwards.
- Restart Cycle: Restart the cycles of the selected executions starting from the beginning.
- View Execution details such as Information, Input, and Output.
The Logs tab provides a granular view of what happens behind the scenes when a node executes.
- It showcases all log entries, including function and service level logs, application installation processes (from initialization to completion), generated during executions of the corresponding node within the selected time-frame.
- Dataloop stores logs for a maximum of 14 days.
- Click on the log to view log details in the bottom.
Utilize the following options to navigate through the logs:
- Search: Enter free text to search through the logs.
- Log Level Filter: Filter logs by selecting a level (critical, error, warning, info, debug) to find logs at that level and above.
- Show Service Logs: Show/hide service-level logs, aiding in the debugging and resolution of service-level errors and issues.
The Instance tab displays all available instances (replicas of services or machines) of the node service, along with their current status—such as 🟡 Initializing, 🟢 Running, or 🔴 Failed.
- It also indicates the number of restarts for each instance, which is useful for identifying services that are failing to activate and continuously restarting.
- Additionally, a monitoring icon is available for each instance. Clicking this icon redirects you to the Instances section of the Service page, where you can monitor detailed health metrics such as CPU and memory usage for each instance.
Generate node allows you to perform the following actions:

Open the Service Page
Open the service page of a pipeline node where you can see Monitoring, Executions, Logs, Triggers, and Instances information of the service. It will be available once you set a model.
- Open the Pipelines page and click on the pipeline from the list.
- Select the node from the pipeline.
- Click on the Action from the right-side panel.
- Click Open Service Page from the list. The Monitoring tab of the service page is displayed.
Open the Model Page
It allows you to open the model that has been referenced. It will be unavailable if there is no model reference.
- Open the Pipelines page and click on the pipeline from the list.
- Select the node from the pipeline.
- Click on the Action from the right-side panel.
- Click Open Model from the list. The Model's Details page is displayed.
Open GitHub Code
It allows you to open the GitHub Code reference for the selected model. It will be unavailable if there is no fixed model selected.
- Open the Pipelines page and click on the pipeline from the list.
- Select the node from the pipeline.
- Click on the Action from the right-side panel.
- Click Open GitHub Code from the list. The GitHub page of the selected model is displayed.
Edit Service Settings
It allows you to make changes to the service settings like Integrations, Service Configuration, and Execution Configuration based on the model you have selected. This option is not available for Train and Validation.
You can now edit the service configuration of a node even while running a pipeline, providing greater flexibility.
- Open the Pipelines page and click on the pipeline from the list.
- Select the node from the pipeline.
- Click on the Action from the right-side panel.
- Click Edit Service Settings from the list. The Edit Service Setting popup window of the service is displayed.
Integrations
The secret values are displayed, if the secret is defined in the dpk/dpkConfig. Click on the Edit Secret to search and select a secret from the list.
- To create a new secret, click Create New -> Create Secret.
- To create a new Integration, click Create New -> Create Integration.
- Click Save Changes, if no additional modifications are needed.
Service Configuration
The service configuration section allows making changes to the following parameters, to change, click on the Edit Configuration.
- Machine Types: The machine type on which the service will run (refers to CPU, GPU, RAM).
- Change the machine type from the list.
- Click on the Machine Settings to enable Preemptible Machine, the reclaimable compute instances.
- Docker Image: A container image encapsulating essential dependencies and code for service execution. By default, the docker image based on the SDK version is displayed. You can modify the URL as required.
- Concurrency: Number of concurrent executions per instance. By default, the value 10 is displayed.
- Scaling Type: Choose the scaling type based on your workload.
- Autoscale: Recommended by default. Autoscaling dynamically adjusts the number of service instances based on the incoming execution load, suitable for changing workloads. When autoscaler reduces instances, it waits for execution timeout before termination.
Min Instances: By default, 0. If you set the min instances to 0, the service will not run until it has something in the queue, it will be suspended.Max Instances: By Default, 2.Queue Size: By default, 10.
- Fixed size: Use fixed scaling when you need a predetermined number of service instances, suitable for consistent workloads. Compute hours counts also when there is no workload. By default, 1 instance is selected.
- Autoscale: Recommended by default. Autoscaling dynamically adjusts the number of service instances based on the incoming execution load, suitable for changing workloads. When autoscaler reduces instances, it waits for execution timeout before termination.
- Click Save Changes, if no additional modifications are needed.
Execution Configuration
The execution configuration section allows making changes to the following parameters, to change, click on the Edit Configuration.
- SDK Version: The SDK version is displayed. Click to select a new version from the list.
- Execution Timeout: The maximum execution duration before service restarts (in seconds). By default, 3600 is displayed.
Drain Time: Delays service restart to complete ongoing executions (in seconds). By default, 600 is displayed.On Reset Action: Action taken when a service is reset or restarted (e.g. timeout). Select one of the following when you reset the execution.- Fail Execution
- Rerun Execution
Max Attempts: Configures to automatically retry failed executions up to x attempts. Maximum number of execution attempts allowed. By default, 3 is displayed.- Bot: A dummy user used for running the service ('developer' role). A default Bot is displayed. Select a new one from the list, if needed.
Rerun executions as process: Defines if each execution will start a new thread or a process. Enable to make the execution as a process.- Click Save Changes.
Edit Access Credentials
You can edit access credentials for models to easily select API keys for seamless application integration.
- Open the Pipelines page and click on the pipeline from the list.
- Select a model node from the pipeline.
- Click on the Action from the right-side panel.
- Click Edit Access Credentials from the list. The Set Credentials popup window is displayed.
- Select the API Key from the list.
- Click Confirm.
Copy the Node ID
Copy node ID of a pipeline node
- Open the Pipelines page and click on the pipeline from the list.
- Select the node from the pipeline.
- Click on the Action from the right-side panel.
- Click Copy Node ID from the list.
View Execution Details
It allows you to view the Executions page of the Application Service.
- Open the Pipelines page and click on the pipeline from the list.
- Select the node from the pipeline.
- Click on the Action from the right-side panel.
- Click View Executions from the list. The Executions tab of the CloudOps Service page is displayed.
View Analytics Details
It allows you to view the Monitoring tab of the Application Service.
- Open the Pipelines page and click on the pipeline from the list.
- Select the node from the pipeline.
- Click on the Action from the right-side panel.
- Click View Analytics from the list. The Monitoring tab of the Application Service page is displayed.
View Log Details
It allows you to view the Logs page of the Application Service from a pipeline node.
- Open the Pipelines page and click on the pipeline from the list.
- Select the node from the pipeline.
- Click on the Action from the right-side panel.
- Click View Logs from the list. The Logs tab of the CloudOps page is displayed.
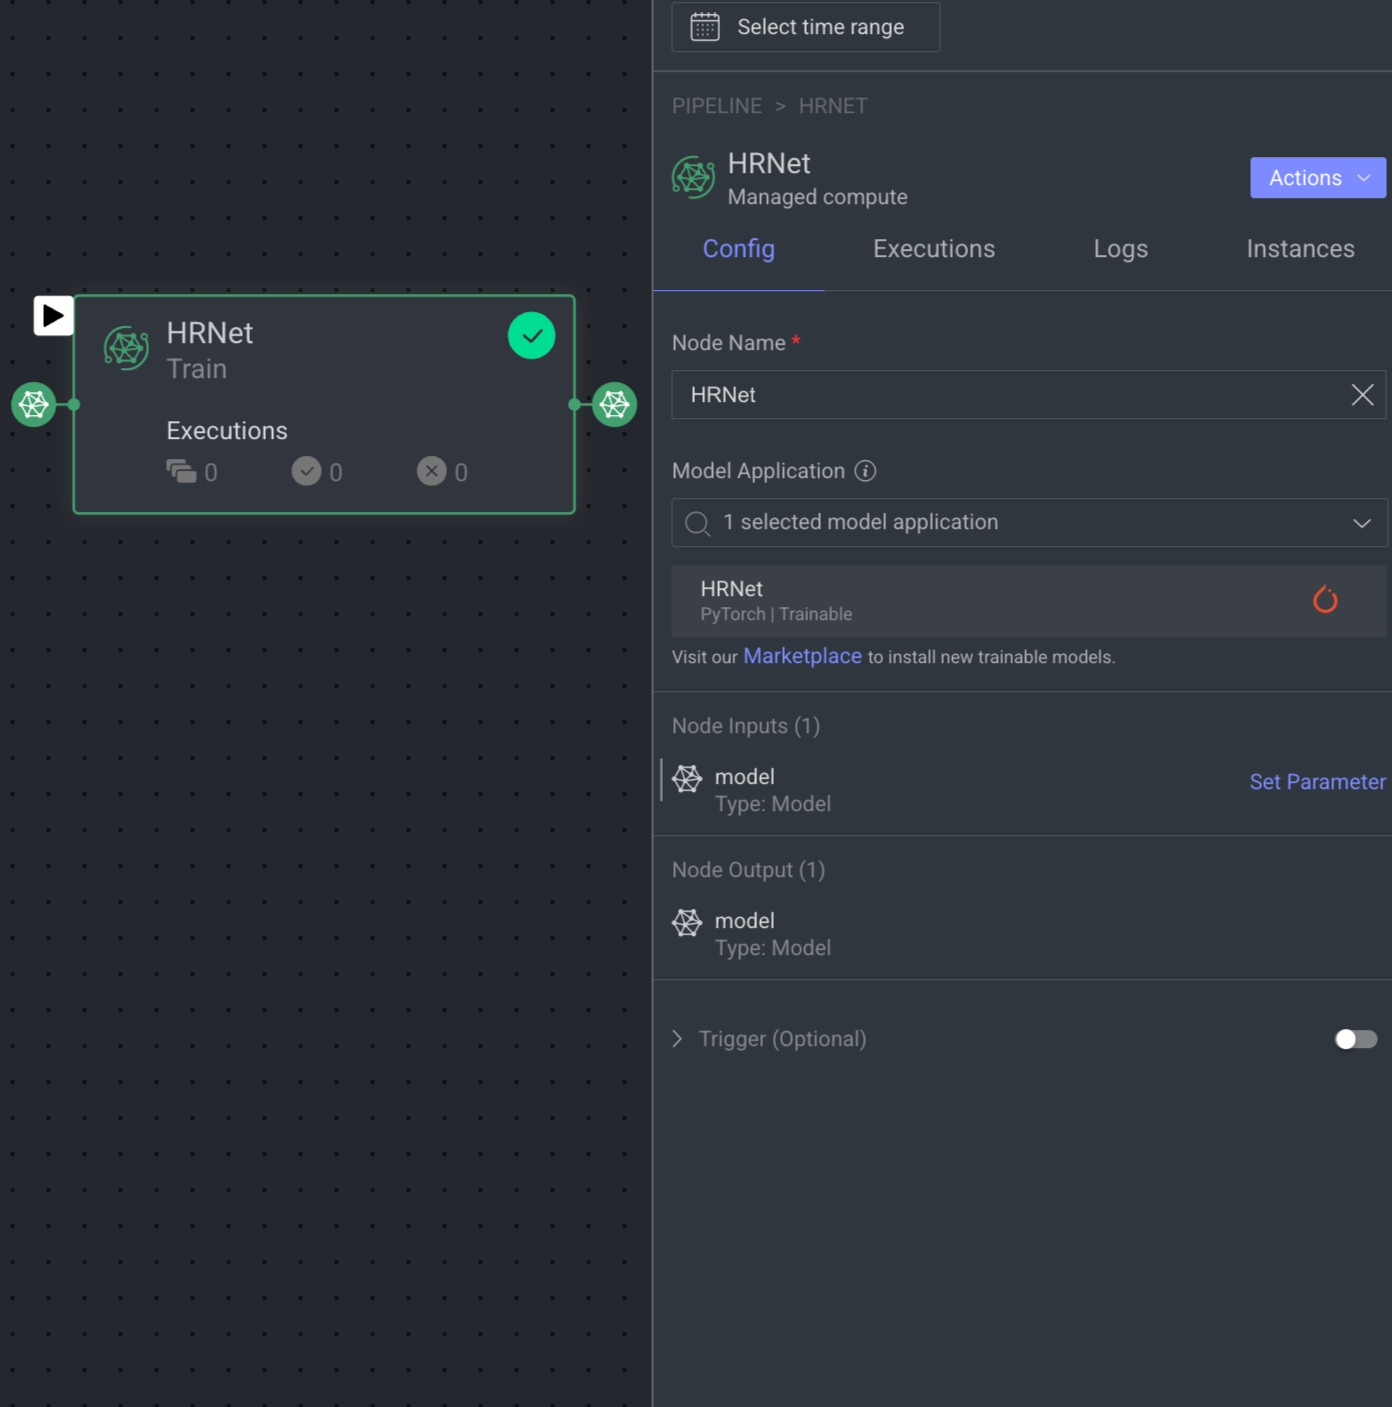
Train Model Node
The Train Model node trains a new model version using labeled data, optimizing its parameters. It integrates into your pipeline, taking an untrained model as input. Once trained, the model seamlessly continues in the pipeline. The node triggers the train() function for accessible models with a created status.
When you click on a Train Model node, its details, such as Configuration, Executions, Logs, and available Actions are shown on the right-side panel.
Set Integration or Secret
A notification with a link to set an integration or a secret will appear if not available in the node.
Node Name: By default, Train Model is displayed as name. You can change it accordingly.
Model Application: It allows you to select an installed trainable-model for the training process. If there is no model available, click on the Install Foundation Model link to install a trainable model from the Marketplace. Once the model is installed, select it from the list.
Input: By default, Type: Model is selected. The input for the node is a model that you want to train.
Output: By default, Type: Model is selected. The output of the node is the trained model. The status will be updated to Trained.
Trigger (Optional): An Event/Cron trigger can be set on this node, enabling you to initiate the pipeline run from this specific point.
When a node is selected, the Executions tab provides details about the execution of each item processed through that node.
- Choose a specific execution from the list to access its detailed information.
- Dataloop stores executions for a maximum of 90 days.
- Use the filter to display executions based on its status.
- Click Rerun Executions to rerun the selected executions. Before you confirm the rerun, you have two actions for the cycles:
- Resume Cycle: Resume the cycles of the selected executions starting from the current node onwards.
- Restart Cycle: Restart the cycles of the selected executions starting from the beginning.
- View Execution details such as Information, Input, and Output.
The Logs tab provides a granular view of what happens behind the scenes when a node executes.
- It showcases all log entries, including function and service level logs, application installation processes (from initialization to completion), generated during executions of the corresponding node within the selected time-frame.
- Dataloop stores logs for a maximum of 14 days.
- Click on the log to view log details in the bottom.
Utilize the following options to navigate through the logs:
- Search: Enter free text to search through the logs.
- Log Level Filter: Filter logs by selecting a level (critical, error, warning, info, debug) to find logs at that level and above.
- Show Service Logs: Show/hide service-level logs, aiding in the debugging and resolution of service-level errors and issues.
The Instance tab displays all available instances (replicas of services or machines) of the node service, along with their current status—such as 🟡 Initializing, 🟢 Running, or 🔴 Failed.
- It also indicates the number of restarts for each instance, which is useful for identifying services that are failing to activate and continuously restarting.
- Additionally, a monitoring icon is available for each instance. Clicking this icon redirects you to the Instances section of the Service page, where you can monitor detailed health metrics such as CPU and memory usage for each instance.
Train node allows you to perform the following actions:

Open the Service Page
Open the service page of a pipeline node where you can see Monitoring, Executions, Logs, Triggers, and Instances information of the service. It will be available once you set a model.
- Open the Pipelines page and click on the pipeline from the list.
- Select the node from the pipeline.
- Click on the Action from the right-side panel.
- Click Open Service Page from the list. The Monitoring tab of the service page is displayed.
Open GitHub Code
It allows you to open the GitHub Code reference for the selected model. It will be unavailable if there is no fixed model selected.
- Open the Pipelines page and click on the pipeline from the list.
- Select the node from the pipeline.
- Click on the Action from the right-side panel.
- Click Open GitHub Code from the list. The GitHub page of the selected model is displayed.
Edit Service Settings
It allows you to make changes to the service settings like Integrations, Service Configuration, and Execution Configuration based on the model you have selected. This option is not available for Train and Validation.
You can now edit the service configuration of a node even while running a pipeline, providing greater flexibility.
- Open the Pipelines page and click on the pipeline from the list.
- Select the node from the pipeline.
- Click on the Action from the right-side panel.
- Click Edit Service Settings from the list. The Edit Service Setting popup window of the service is displayed.
Integrations
The secret values are displayed, if the secret is defined in the dpk/dpkConfig. Click on the Edit Secret to search and select a secret from the list.
- To create a new secret, click Create New -> Create Secret.
- To create a new Integration, click Create New -> Create Integration.
- Click Save Changes, if no additional modifications are needed.
Service Configuration
The service configuration section allows making changes to the following parameters, to change, click on the Edit Configuration.
- Machine Types: The machine type on which the service will run (refers to CPU, GPU, RAM).
- Change the machine type from the list.
- Click on the Machine Settings to enable Preemptible Machine, the reclaimable compute instances.
- Docker Image: A container image encapsulating essential dependencies and code for service execution. By default, the docker image based on the SDK version is displayed. You can modify the URL as required.
- Concurrency: Number of concurrent executions per instance. By default, the value 10 is displayed.
- Scaling Type: Choose the scaling type based on your workload.
- Autoscale: Recommended by default. Autoscaling dynamically adjusts the number of service instances based on the incoming execution load, suitable for changing workloads. When autoscaler reduces instances, it waits for execution timeout before termination.
Min Instances: By default, 0. If you set the min instances to 0, the service will not run until it has something in the queue, it will be suspended.Max Instances: By Default, 2.Queue Size: By default, 10.
- Fixed size: Use fixed scaling when you need a predetermined number of service instances, suitable for consistent workloads. Compute hours counts also when there is no workload. By default, 1 instance is selected.
- Autoscale: Recommended by default. Autoscaling dynamically adjusts the number of service instances based on the incoming execution load, suitable for changing workloads. When autoscaler reduces instances, it waits for execution timeout before termination.
- Click Save Changes, if no additional modifications are needed.
Execution Configuration
The execution configuration section allows making changes to the following parameters, to change, click on the Edit Configuration.
- SDK Version: The SDK version is displayed. Click to select a new version from the list.
- Execution Timeout: The maximum execution duration before service restarts (in seconds). By default, 3600 is displayed.
Drain Time: Delays service restart to complete ongoing executions (in seconds). By default, 600 is displayed.On Reset Action: Action taken when a service is reset or restarted (e.g. timeout). Select one of the following when you reset the execution.- Fail Execution
- Rerun Execution
Max Attempts: Configures to automatically retry failed executions up to x attempts. Maximum number of execution attempts allowed. By default, 3 is displayed.- Bot: A dummy user used for running the service ('developer' role). A default Bot is displayed. Select a new one from the list, if needed.
Rerun executions as process: Defines if each execution will start a new thread or a process. Enable to make the execution as a process.- Click Save Changes.
Edit Access Credentials
You can edit access credentials for models to easily select API keys for seamless application integration.
- Open the Pipelines page and click on the pipeline from the list.
- Select a model node from the pipeline.
- Click on the Action from the right-side panel.
- Click Edit Access Credentials from the list. The Set Credentials popup window is displayed.
- Select the API Key from the list.
- Click Confirm.
Copy the Node ID
Copy node ID of a pipeline node
- Open the Pipelines page and click on the pipeline from the list.
- Select the node from the pipeline.
- Click on the Action from the right-side panel.
- Click Copy Node ID from the list.
View Execution Details
It allows you to view the Executions page of the Application Service.
- Open the Pipelines page and click on the pipeline from the list.
- Select the node from the pipeline.
- Click on the Action from the right-side panel.
- Click View Executions from the list. The Executions tab of the CloudOps Service page is displayed.
View Log Details
It allows you to view the Logs page of the Application Service from a pipeline node.
- Open the Pipelines page and click on the pipeline from the list.
- Select the node from the pipeline.
- Click on the Action from the right-side panel.
- Click View Logs from the list. The Logs tab of the CloudOps page is displayed.
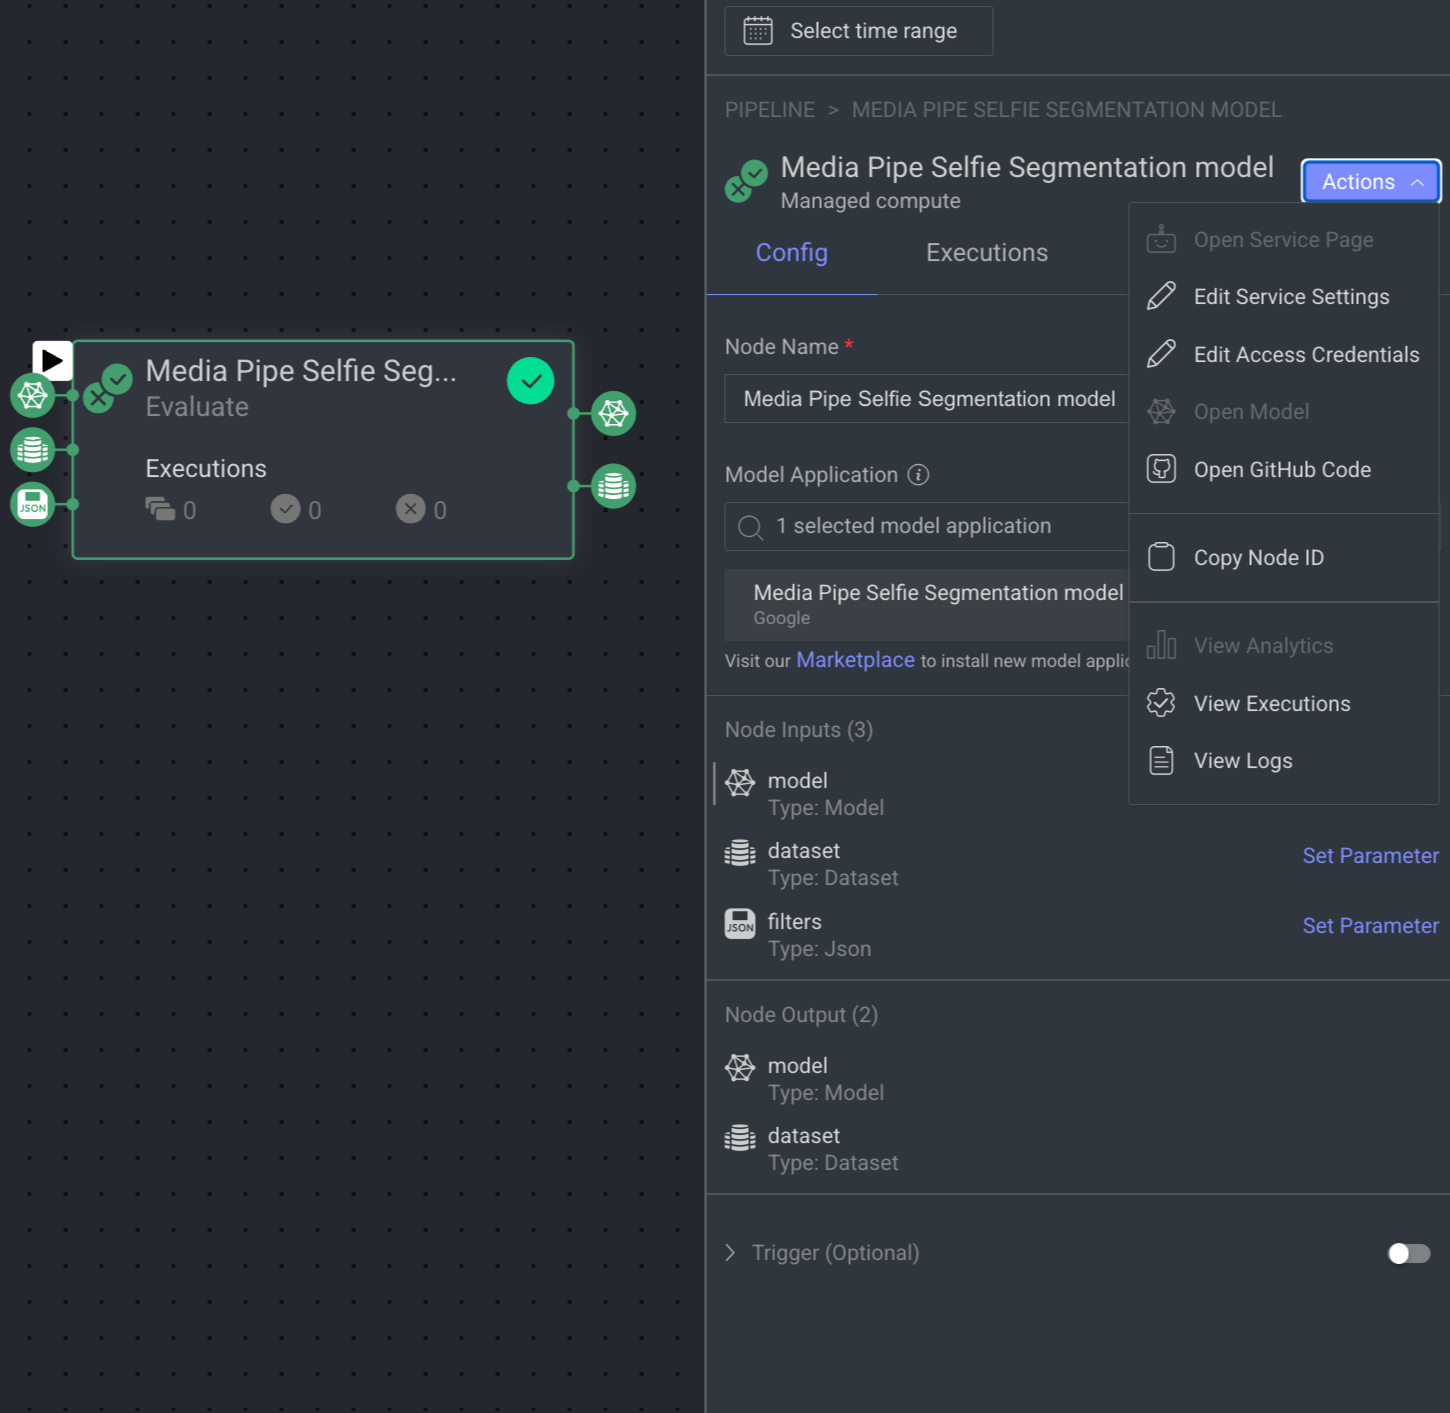
Evaluate Model Node
The Evaluate Model node generates predictions from a trained model on a test dataset and compares them to ground truth annotations. It uploads evaluation scores for downstream use, such as in the Compare Models node. Performance is assessed using predefined or custom evaluation metrics.
Set Integration or Secret
A notification with a link to set an integration or a secret will appear if not available in the node.
When you click on an Evaluate Model node, its details, such as Configuration, Executions, Logs, and available Actions are shown on the right-side panel.
Node Name: By default, Evaluate Model is displayed as name. You can change it accordingly.
Model Application: It allows you to select an installed model for the evaluation process. If there is no model available, click on the Install Foundation Model link to install a model from the Marketplace. Once the model is installed, select it from the list.
Node Input: By default, the following are selected:
Type: Model: The trained model used for evaluation.
Type: Dataset: The dataset used to do the evaluation of the trained model. For example, the ground truth for the active learning pipeline.
Type: JSON (filters): The filter used to do the evaluation of the trained model.
Node Output: By default, the following are selected:
Type: Model: The output model has been evaluated.
Type: Dataset: The dataset that has been evaluated by using the trained model.
Trigger (Optional): An Event/Cron trigger can be set on this node, enabling you to initiate the pipeline run from this specific point.
When a node is selected, the Executions tab provides details about the execution of each item processed through that node.
- Choose a specific execution from the list to access its detailed information.
- Dataloop stores executions for a maximum of 90 days.
- Use the filter to display executions based on its status.
- Click Rerun Executions to rerun the selected executions. Before you confirm the rerun, you have two actions for the cycles:
- Resume Cycle: Resume the cycles of the selected executions starting from the current node onwards.
- Restart Cycle: Restart the cycles of the selected executions starting from the beginning.
- View Execution details such as Information, Input, and Output.
The Logs tab provides a granular view of what happens behind the scenes when a node executes.
- It showcases all log entries, including function and service level logs, application installation processes (from initialization to completion), generated during executions of the corresponding node within the selected time-frame.
- Dataloop stores logs for a maximum of 14 days.
- Click on the log to view log details in the bottom.
Utilize the following options to navigate through the logs:
- Search: Enter free text to search through the logs.
- Log Level Filter: Filter logs by selecting a level (critical, error, warning, info, debug) to find logs at that level and above.
- Show Service Logs: Show/hide service-level logs, aiding in the debugging and resolution of service-level errors and issues.
The Instance tab displays all available instances (replicas of services or machines) of the node service, along with their current status—such as 🟡 Initializing, 🟢 Running, or 🔴 Failed.
- It also indicates the number of restarts for each instance, which is useful for identifying services that are failing to activate and continuously restarting.
- Additionally, a monitoring icon is available for each instance. Clicking this icon redirects you to the Instances section of the Service page, where you can monitor detailed health metrics such as CPU and memory usage for each instance.
Evaluate node allows you to perform the following actions:

Open GitHub Code
It allows you to open the GitHub Code reference for the selected model. It will be unavailable if there is no fixed model selected.
- Open the Pipelines page and click on the pipeline from the list.
- Select the node from the pipeline.
- Click on the Action from the right-side panel.
- Click Open GitHub Code from the list. The GitHub page of the selected model is displayed.
Edit Service Settings
It allows you to make changes to the service settings like Integrations, Service Configuration, and Execution Configuration based on the model you have selected. This option is not available for Train and Validation.
You can now edit the service configuration of a node even while running a pipeline, providing greater flexibility.
- Open the Pipelines page and click on the pipeline from the list.
- Select the node from the pipeline.
- Click on the Action from the right-side panel.
- Click Edit Service Settings from the list. The Edit Service Setting popup window of the service is displayed.
Integrations
The secret values are displayed, if the secret is defined in the dpk/dpkConfig. Click on the Edit Secret to search and select a secret from the list.
- To create a new secret, click Create New -> Create Secret.
- To create a new Integration, click Create New -> Create Integration.
- Click Save Changes, if no additional modifications are needed.
Service Configuration
The service configuration section allows making changes to the following parameters, to change, click on the Edit Configuration.
- Machine Types: The machine type on which the service will run (refers to CPU, GPU, RAM).
- Change the machine type from the list.
- Click on the Machine Settings to enable Preemptible Machine, the reclaimable compute instances.
- Docker Image: A container image encapsulating essential dependencies and code for service execution. By default, the docker image based on the SDK version is displayed. You can modify the URL as required.
- Concurrency: Number of concurrent executions per instance. By default, the value 10 is displayed.
- Scaling Type: Choose the scaling type based on your workload.
- Autoscale: Recommended by default. Autoscaling dynamically adjusts the number of service instances based on the incoming execution load, suitable for changing workloads. When autoscaler reduces instances, it waits for execution timeout before termination.
Min Instances: By default, 0. If you set the min instances to 0, the service will not run until it has something in the queue, it will be suspended.Max Instances: By Default, 2.Queue Size: By default, 10.
- Fixed size: Use fixed scaling when you need a predetermined number of service instances, suitable for consistent workloads. Compute hours counts also when there is no workload. By default, 1 instance is selected.
- Autoscale: Recommended by default. Autoscaling dynamically adjusts the number of service instances based on the incoming execution load, suitable for changing workloads. When autoscaler reduces instances, it waits for execution timeout before termination.
- Click Save Changes, if no additional modifications are needed.
Execution Configuration
The execution configuration section allows making changes to the following parameters, to change, click on the Edit Configuration.
- SDK Version: The SDK version is displayed. Click to select a new version from the list.
- Execution Timeout: The maximum execution duration before service restarts (in seconds). By default, 3600 is displayed.
Drain Time: Delays service restart to complete ongoing executions (in seconds). By default, 600 is displayed.On Reset Action: Action taken when a service is reset or restarted (e.g. timeout). Select one of the following when you reset the execution.- Fail Execution
- Rerun Execution
Max Attempts: Configures to automatically retry failed executions up to x attempts. Maximum number of execution attempts allowed. By default, 3 is displayed.- Bot: A dummy user used for running the service ('developer' role). A default Bot is displayed. Select a new one from the list, if needed.
Rerun executions as process: Defines if each execution will start a new thread or a process. Enable to make the execution as a process.- Click Save Changes.
Edit Access Credentials
You can edit access credentials for models to easily select API keys for seamless application integration.
- Open the Pipelines page and click on the pipeline from the list.
- Select a model node from the pipeline.
- Click on the Action from the right-side panel.
- Click Edit Access Credentials from the list. The Set Credentials popup window is displayed.
- Select the API Key from the list.
- Click Confirm.
Copy the Node ID
Copy node ID of a pipeline node
- Open the Pipelines page and click on the pipeline from the list.
- Select the node from the pipeline.
- Click on the Action from the right-side panel.
- Click Copy Node ID from the list.
View Execution Details
It allows you to view the Executions page of the Application Service.
- Open the Pipelines page and click on the pipeline from the list.
- Select the node from the pipeline.
- Click on the Action from the right-side panel.
- Click View Executions from the list. The Executions tab of the CloudOps Service page is displayed.
View Log Details
It allows you to view the Logs page of the Application Service from a pipeline node.
- Open the Pipelines page and click on the pipeline from the list.
- Select the node from the pipeline.
- Click on the Action from the right-side panel.
- Click View Logs from the list. The Logs tab of the CloudOps page is displayed.
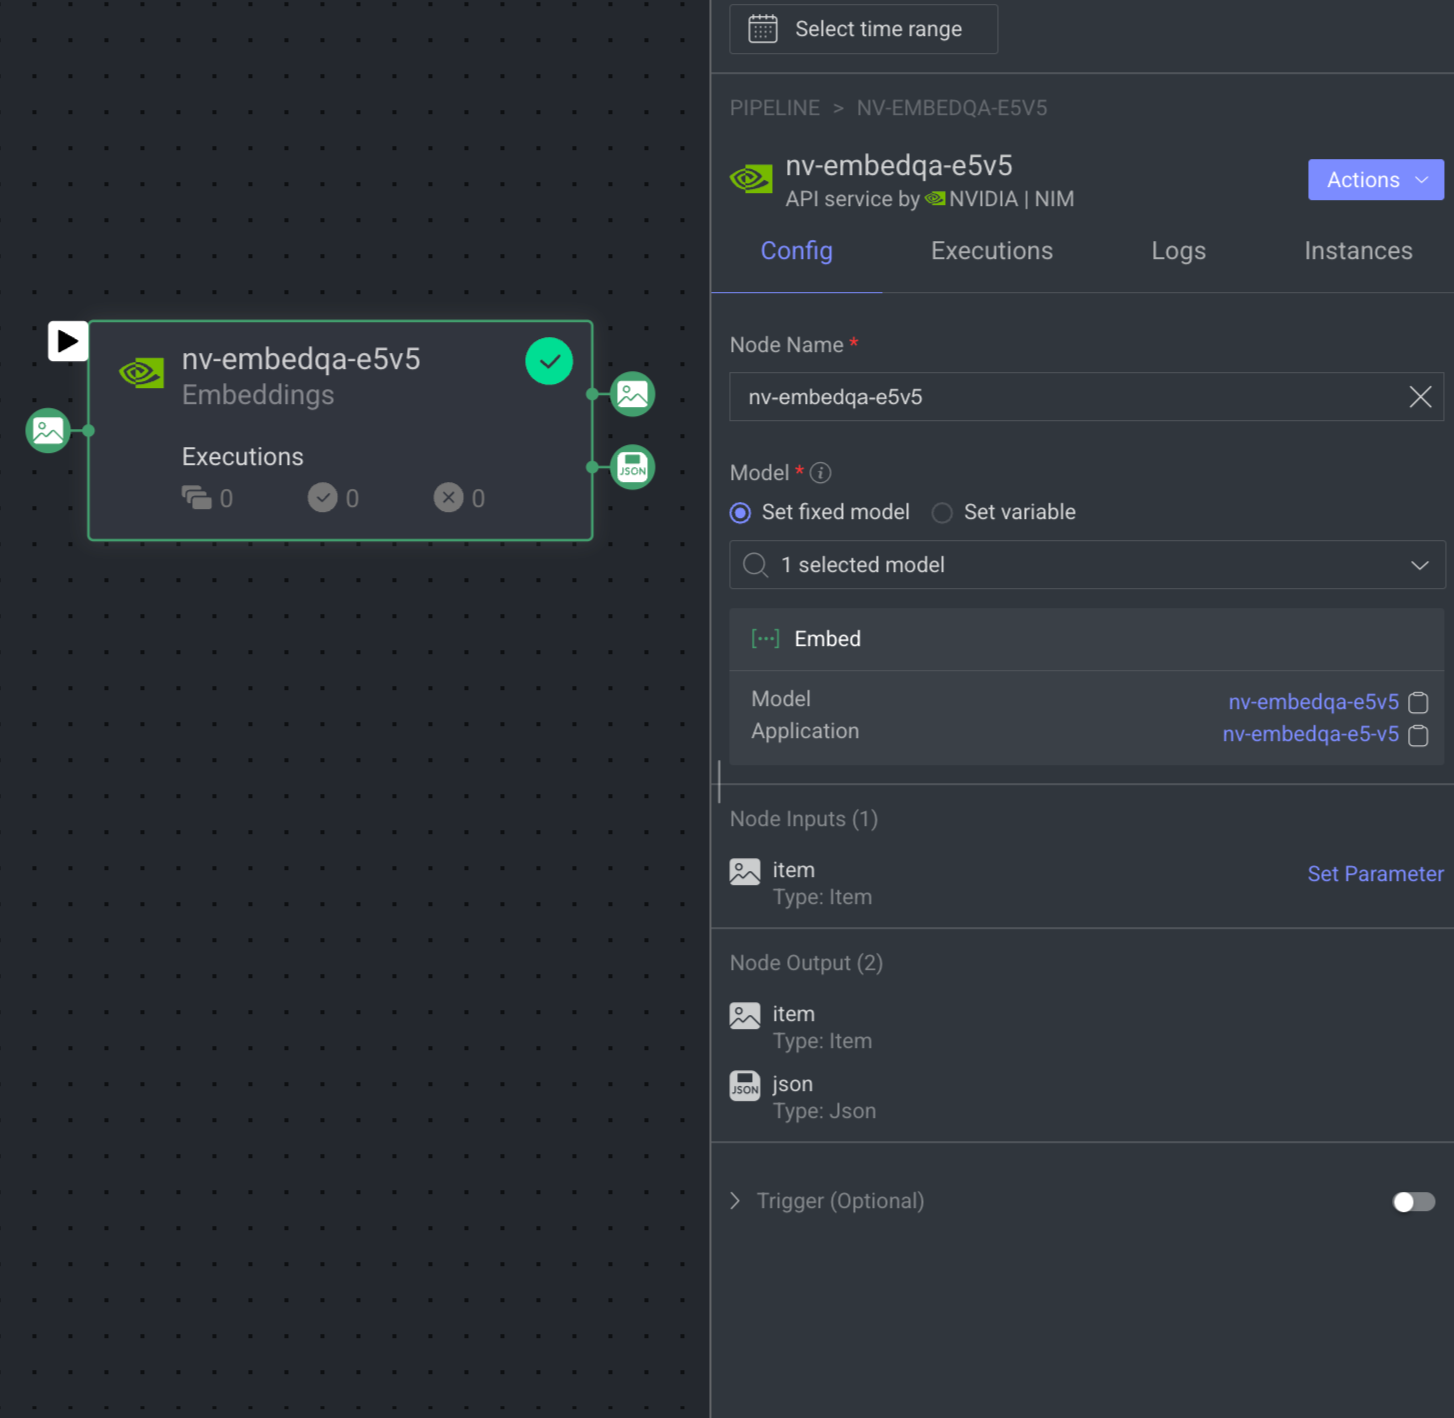
Embeddings Model Node
The Embedding node allows you to integrate any embedding model into your pipeline, either directly from the DDOE marketplace or using your own custom model. Extract embeddings from your data for tasks such as similarity search, clustering, data curation, RAG pipelines, and more.
Set Integration or Secret
A notification with a link to set an integration or a secret will appear if not available in the node.
When you click on the Embeddings node, its details, such as Configuration, Executions, Logs, Instances, and available Actions are shown on the right-side panel.
Node Name: By default, Embeddings is displayed as name. You can change it if required.
Model: Select an Embedding model (listing all model entities with ‘embed’/'embed_items' function in the dpk.module that are available in the project) from the list, either Set a fixed model or Set a variable (Type: model) that can be updated dynamically during pipeline execution. If there is no model available, click on the Install Foundation Model link to install it from the Marketplace. Also, you can click on the model and application name to view more information.
Input: By default, Type: Item is selected.
Output: By default, Type: Item and JSON are available.
Trigger (Optional): An Event/Cron trigger can be set on this node, enabling you to initiate the pipeline run from this specific point.
When a node is selected, the Executions tab provides details about the execution of each item processed through that node.
- Choose a specific execution from the list to access its detailed information.
- Dataloop stores executions for a maximum of 90 days.
- Use the filter to display executions based on its status.
- Click Rerun Executions to rerun the selected executions. Before you confirm the rerun, you have two actions for the cycles:
- Resume Cycle: Resume the cycles of the selected executions starting from the current node onwards.
- Restart Cycle: Restart the cycles of the selected executions starting from the beginning.
- View Execution details such as Information, Input, and Output.
The Logs tab provides a granular view of what happens behind the scenes when a node executes.
- It showcases all log entries, including function and service level logs, application installation processes (from initialization to completion), generated during executions of the corresponding node within the selected time-frame.
- Dataloop stores logs for a maximum of 14 days.
- Click on the log to view log details in the bottom.
Utilize the following options to navigate through the logs:
- Search: Enter free text to search through the logs.
- Log Level Filter: Filter logs by selecting a level (critical, error, warning, info, debug) to find logs at that level and above.
- Show Service Logs: Show/hide service-level logs, aiding in the debugging and resolution of service-level errors and issues.
The Instance tab displays all available instances (replicas of services or machines) of the node service, along with their current status—such as 🟡 Initializing, 🟢 Running, or 🔴 Failed.
- It also indicates the number of restarts for each instance, which is useful for identifying services that are failing to activate and continuously restarting.
- Additionally, a monitoring icon is available for each instance. Clicking this icon redirects you to the Instances section of the Service page, where you can monitor detailed health metrics such as CPU and memory usage for each instance.
Embeddings node allows you to perform the following actions:

Open GitHub Code
It allows you to open the GitHub Code reference for the selected model. It will be unavailable if there is no fixed model selected.
- Open the Pipelines page and click on the pipeline from the list.
- Select the node from the pipeline.
- Click on the Action from the right-side panel.
- Click Open GitHub Code from the list. The GitHub page of the selected model is displayed.
Edit Service Settings
It allows you to make changes to the service settings like Integrations, Service Configuration, and Execution Configuration based on the model you have selected. This option is not available for Train and Validation.
You can now edit the service configuration of a node even while running a pipeline, providing greater flexibility.
- Open the Pipelines page and click on the pipeline from the list.
- Select the node from the pipeline.
- Click on the Action from the right-side panel.
- Click Edit Service Settings from the list. The Edit Service Setting popup window of the service is displayed.
Integrations
The secret values are displayed, if the secret is defined in the dpk/dpkConfig. Click on the Edit Secret to search and select a secret from the list.
- To create a new secret, click Create New -> Create Secret.
- To create a new Integration, click Create New -> Create Integration.
- Click Save Changes, if no additional modifications are needed.
Service Configuration
The service configuration section allows making changes to the following parameters, to change, click on the Edit Configuration.
- Machine Types: The machine type on which the service will run (refers to CPU, GPU, RAM).
- Change the machine type from the list.
- Click on the Machine Settings to enable Preemptible Machine, the reclaimable compute instances.
- Docker Image: A container image encapsulating essential dependencies and code for service execution. By default, the docker image based on the SDK version is displayed. You can modify the URL as required.
- Concurrency: Number of concurrent executions per instance. By default, the value 10 is displayed.
- Scaling Type: Choose the scaling type based on your workload.
- Autoscale: Recommended by default. Autoscaling dynamically adjusts the number of service instances based on the incoming execution load, suitable for changing workloads. When autoscaler reduces instances, it waits for execution timeout before termination.
Min Instances: By default, 0. If you set the min instances to 0, the service will not run until it has something in the queue, it will be suspended.Max Instances: By Default, 2.Queue Size: By default, 10.
- Fixed size: Use fixed scaling when you need a predetermined number of service instances, suitable for consistent workloads. Compute hours counts also when there is no workload. By default, 1 instance is selected.
- Autoscale: Recommended by default. Autoscaling dynamically adjusts the number of service instances based on the incoming execution load, suitable for changing workloads. When autoscaler reduces instances, it waits for execution timeout before termination.
- Click Save Changes, if no additional modifications are needed.
Execution Configuration
The execution configuration section allows making changes to the following parameters, to change, click on the Edit Configuration.
- SDK Version: The SDK version is displayed. Click to select a new version from the list.
- Execution Timeout: The maximum execution duration before service restarts (in seconds). By default, 3600 is displayed.
Drain Time: Delays service restart to complete ongoing executions (in seconds). By default, 600 is displayed.On Reset Action: Action taken when a service is reset or restarted (e.g. timeout). Select one of the following when you reset the execution.- Fail Execution
- Rerun Execution
Max Attempts: Configures to automatically retry failed executions up to x attempts. Maximum number of execution attempts allowed. By default, 3 is displayed.- Bot: A dummy user used for running the service ('developer' role). A default Bot is displayed. Select a new one from the list, if needed.
Rerun executions as process: Defines if each execution will start a new thread or a process. Enable to make the execution as a process.- Click Save Changes.
Edit Access Credentials
You can edit access credentials for models to easily select API keys for seamless application integration.
- Open the Pipelines page and click on the pipeline from the list.
- Select a model node from the pipeline.
- Click on the Action from the right-side panel.
- Click Edit Access Credentials from the list. The Set Credentials popup window is displayed.
- Select the API Key from the list.
- Click Confirm.
Open the Model Page
It allows you to open the model that has been referenced. It will be unavailable if there is no model reference.
- Open the Pipelines page and click on the pipeline from the list.
- Select the node from the pipeline.
- Click on the Action from the right-side panel.
- Click Open Model from the list. The Model's Details page is displayed.
Copy the Node ID
Copy node ID of a pipeline node
- Open the Pipelines page and click on the pipeline from the list.
- Select the node from the pipeline.
- Click on the Action from the right-side panel.
- Click Copy Node ID from the list.
View Execution Details
It allows you to view the Executions page of the Application Service.
- Open the Pipelines page and click on the pipeline from the list.
- Select the node from the pipeline.
- Click on the Action from the right-side panel.
- Click View Executions from the list. The Executions tab of the CloudOps Service page is displayed.
View Log Details
It allows you to view the Logs page of the Application Service from a pipeline node.
- Open the Pipelines page and click on the pipeline from the list.
- Select the node from the pipeline.
- Click on the Action from the right-side panel.
- Click View Logs from the list. The Logs tab of the CloudOps page is displayed.
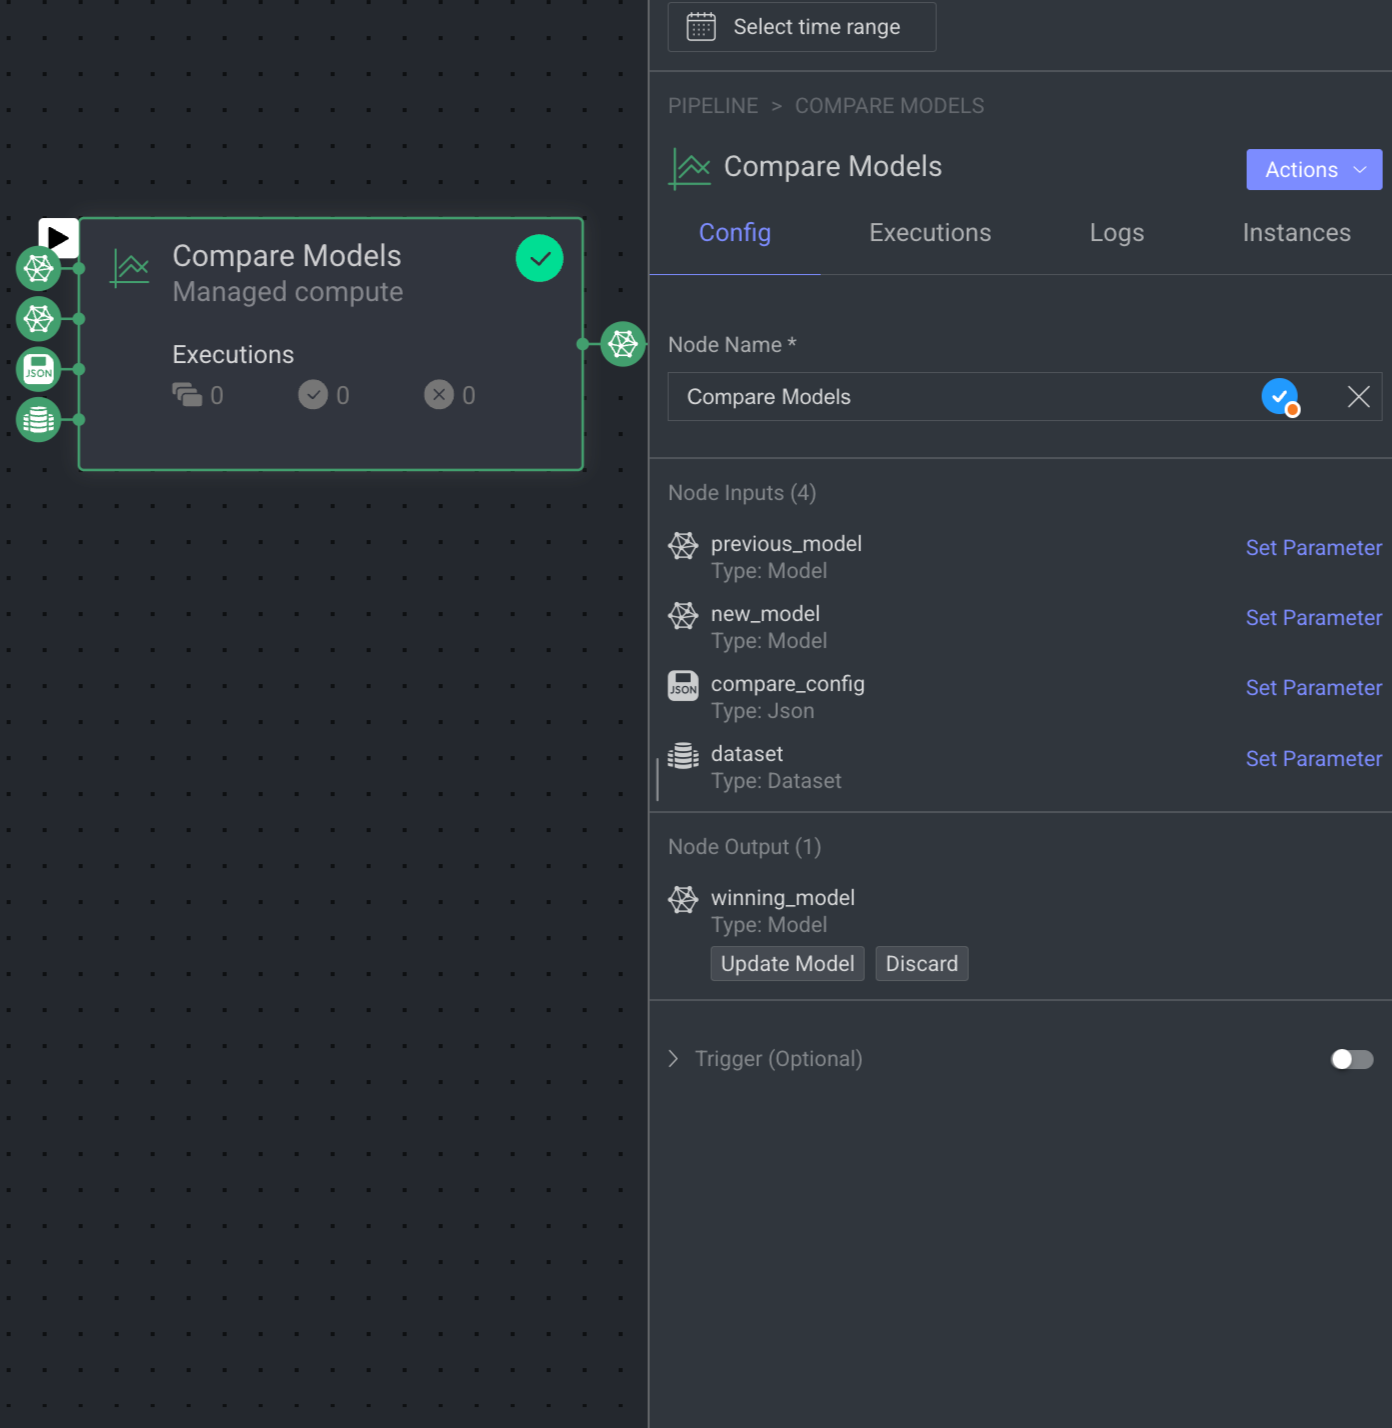
Compare Models Node
The Compare Models node compares two trained model versions using evaluation results from the same test set or training metrics. It requires a comparison configuration (JSON) and two models: Previous and New. If the New model outperforms the Previous model, it is marked as "Update model" for deployment; otherwise, it is labeled "Discard."
The parameters that need defining are:
Node Name: Name of the node.
Node Inputs:
previous_model: By default, Type: Model is selected.
new_model: By default, Type: Model is selected.
compare_config: The configurations for the comparison (JSON): By default, Type: JSON is selected.
dataset: By default, Type: Dataset is selected.
Output:
winning_model: By default, Type: Model is selected. Available statuses are Update Model and Discard.
Trigger (Optional): An Event/Cron trigger can be set on this node, enabling you to initiate the pipeline run from this specific point.
When a node is selected, the Executions tab provides details about the execution of each item processed through that node.
- Choose a specific execution from the list to access its detailed information.
- Dataloop stores executions for a maximum of 90 days.
- Use the filter to display executions based on its status.
- Click Rerun Executions to rerun the selected executions. Before you confirm the rerun, you have two actions for the cycles:
- Resume Cycle: Resume the cycles of the selected executions starting from the current node onwards.
- Restart Cycle: Restart the cycles of the selected executions starting from the beginning.
- View Execution details such as Information, Input, and Output.
The Logs tab provides a granular view of what happens behind the scenes when a node executes.
- It showcases all log entries, including function and service level logs, application installation processes (from initialization to completion), generated during executions of the corresponding node within the selected time-frame.
- Dataloop stores logs for a maximum of 14 days.
- Click on the log to view log details in the bottom.
Utilize the following options to navigate through the logs:
- Search: Enter free text to search through the logs.
- Log Level Filter: Filter logs by selecting a level (critical, error, warning, info, debug) to find logs at that level and above.
- Show Service Logs: Show/hide service-level logs, aiding in the debugging and resolution of service-level errors and issues.
The Instance tab displays all available instances (replicas of services or machines) of the node service, along with their current status—such as 🟡 Initializing, 🟢 Running, or 🔴 Failed.
- It also indicates the number of restarts for each instance, which is useful for identifying services that are failing to activate and continuously restarting.
- Additionally, a monitoring icon is available for each instance. Clicking this icon redirects you to the Instances section of the Service page, where you can monitor detailed health metrics such as CPU and memory usage for each instance.
Compare node allows you to perform the following actions:

Open GitHub Code
It allows you to open the GitHub Code reference for the selected model. It will be unavailable if there is no fixed model selected.
- Open the Pipelines page and click on the pipeline from the list.
- Select the node from the pipeline.
- Click on the Action from the right-side panel.
- Click Open GitHub Code from the list. The GitHub page of the selected model is displayed.
Edit Service Settings
It allows you to make changes to the service settings like Integrations, Service Configuration, and Execution Configuration based on the model you have selected. This option is not available for Train and Validation.
You can now edit the service configuration of a node even while running a pipeline, providing greater flexibility.
- Open the Pipelines page and click on the pipeline from the list.
- Select the node from the pipeline.
- Click on the Action from the right-side panel.
- Click Edit Service Settings from the list. The Edit Service Setting popup window of the service is displayed.
Integrations
The secret values are displayed, if the secret is defined in the dpk/dpkConfig. Click on the Edit Secret to search and select a secret from the list.
- To create a new secret, click Create New -> Create Secret.
- To create a new Integration, click Create New -> Create Integration.
- Click Save Changes, if no additional modifications are needed.
Service Configuration
The service configuration section allows making changes to the following parameters, to change, click on the Edit Configuration.
- Machine Types: The machine type on which the service will run (refers to CPU, GPU, RAM).
- Change the machine type from the list.
- Click on the Machine Settings to enable Preemptible Machine, the reclaimable compute instances.
- Docker Image: A container image encapsulating essential dependencies and code for service execution. By default, the docker image based on the SDK version is displayed. You can modify the URL as required.
- Concurrency: Number of concurrent executions per instance. By default, the value 10 is displayed.
- Scaling Type: Choose the scaling type based on your workload.
- Autoscale: Recommended by default. Autoscaling dynamically adjusts the number of service instances based on the incoming execution load, suitable for changing workloads. When autoscaler reduces instances, it waits for execution timeout before termination.
Min Instances: By default, 0. If you set the min instances to 0, the service will not run until it has something in the queue, it will be suspended.Max Instances: By Default, 2.Queue Size: By default, 10.
- Fixed size: Use fixed scaling when you need a predetermined number of service instances, suitable for consistent workloads. Compute hours counts also when there is no workload. By default, 1 instance is selected.
- Autoscale: Recommended by default. Autoscaling dynamically adjusts the number of service instances based on the incoming execution load, suitable for changing workloads. When autoscaler reduces instances, it waits for execution timeout before termination.
- Click Save Changes, if no additional modifications are needed.
Execution Configuration
The execution configuration section allows making changes to the following parameters, to change, click on the Edit Configuration.
- SDK Version: The SDK version is displayed. Click to select a new version from the list.
- Execution Timeout: The maximum execution duration before service restarts (in seconds). By default, 3600 is displayed.
Drain Time: Delays service restart to complete ongoing executions (in seconds). By default, 600 is displayed.On Reset Action: Action taken when a service is reset or restarted (e.g. timeout). Select one of the following when you reset the execution.- Fail Execution
- Rerun Execution
Max Attempts: Configures to automatically retry failed executions up to x attempts. Maximum number of execution attempts allowed. By default, 3 is displayed.- Bot: A dummy user used for running the service ('developer' role). A default Bot is displayed. Select a new one from the list, if needed.
Rerun executions as process: Defines if each execution will start a new thread or a process. Enable to make the execution as a process.- Click Save Changes.
Edit Access Credentials
You can edit access credentials for models to easily select API keys for seamless application integration.
- Open the Pipelines page and click on the pipeline from the list.
- Select a model node from the pipeline.
- Click on the Action from the right-side panel.
- Click Edit Access Credentials from the list. The Set Credentials popup window is displayed.
- Select the API Key from the list.
- Click Confirm.
Copy the Node ID
Copy node ID of a pipeline node
- Open the Pipelines page and click on the pipeline from the list.
- Select the node from the pipeline.
- Click on the Action from the right-side panel.
- Click Copy Node ID from the list.
View Execution Details
It allows you to view the Executions page of the Application Service.
- Open the Pipelines page and click on the pipeline from the list.
- Select the node from the pipeline.
- Click on the Action from the right-side panel.
- Click View Executions from the list. The Executions tab of the CloudOps Service page is displayed.
View Log Details
It allows you to view the Logs page of the Application Service from a pipeline node.
- Open the Pipelines page and click on the pipeline from the list.
- Select the node from the pipeline.
- Click on the Action from the right-side panel.
- Click View Logs from the list. The Logs tab of the CloudOps page is displayed.
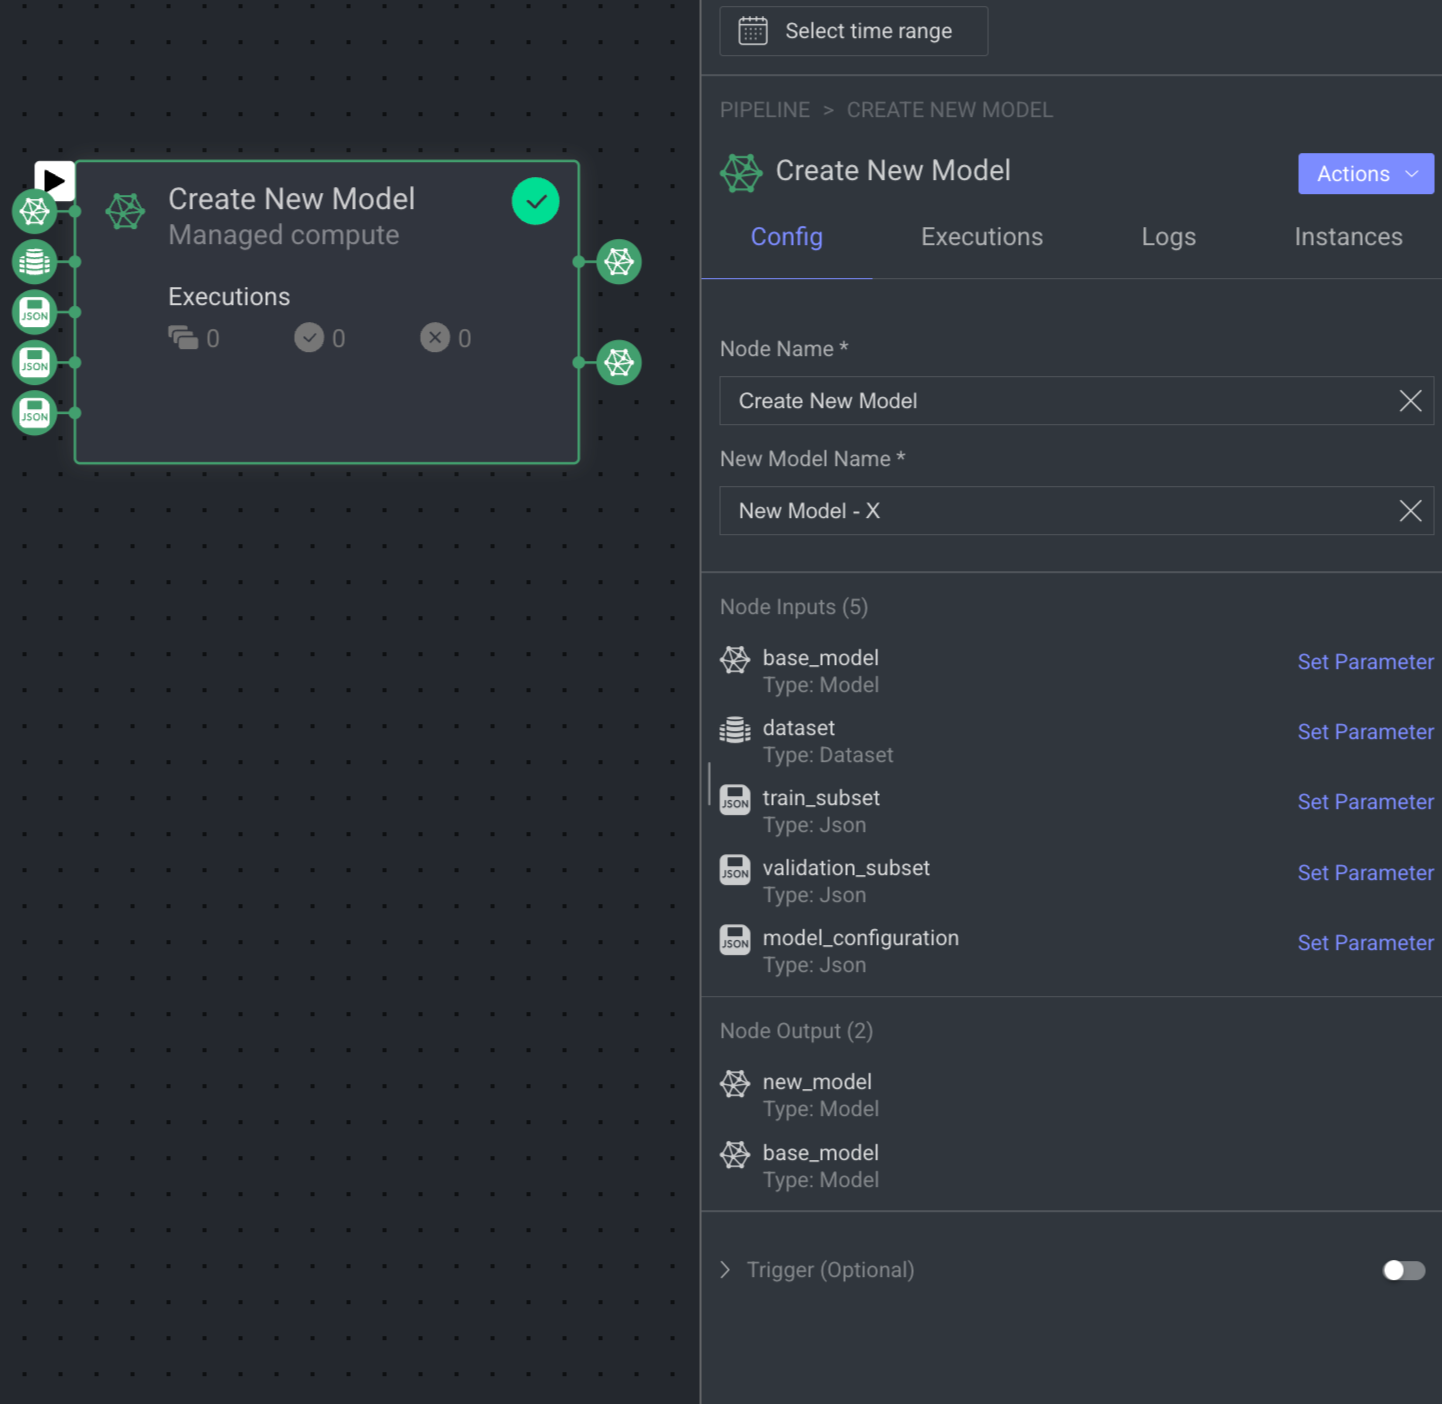
Create New Model Node
The 'Create New Model' node clones an existing model to create a new version for fine-tuning. It requires a base model, model configurations (in JSON), and datasets with subsets for training and validation. The node outputs the new model after execution.
The parameters that need defining are:
Node Name: Display name on the canvas.
Node Inputs:
base_model - the model to clone:
dataset - the dataset to train on
train_subset - the DQL query for the subset of training items (JSON)
validation_subset - the DQL query for the subset of validation items (JSON)
model_configuration - the model configurations to use for training (JSON)
Output:
new_model: The newly created model.
base_model: the model to clone.
Trigger (Optional): An Event/Cron trigger can be set on this node, enabling you to initiate the pipeline run from this specific point.
When a node is selected, the Executions tab provides details about the execution of each item processed through that node.
- Choose a specific execution from the list to access its detailed information.
- Dataloop stores executions for a maximum of 90 days.
- Use the filter to display executions based on its status.
- Click Rerun Executions to rerun the selected executions. Before you confirm the rerun, you have two actions for the cycles:
- Resume Cycle: Resume the cycles of the selected executions starting from the current node onwards.
- Restart Cycle: Restart the cycles of the selected executions starting from the beginning.
- View Execution details such as Information, Input, and Output.
The Logs tab provides a granular view of what happens behind the scenes when a node executes.
- It showcases all log entries, including function and service level logs, application installation processes (from initialization to completion), generated during executions of the corresponding node within the selected time-frame.
- Dataloop stores logs for a maximum of 14 days.
- Click on the log to view log details in the bottom.
Utilize the following options to navigate through the logs:
- Search: Enter free text to search through the logs.
- Log Level Filter: Filter logs by selecting a level (critical, error, warning, info, debug) to find logs at that level and above.
- Show Service Logs: Show/hide service-level logs, aiding in the debugging and resolution of service-level errors and issues.
The Instance tab displays all available instances (replicas of services or machines) of the node service, along with their current status—such as 🟡 Initializing, 🟢 Running, or 🔴 Failed.
- It also indicates the number of restarts for each instance, which is useful for identifying services that are failing to activate and continuously restarting.
- Additionally, a monitoring icon is available for each instance. Clicking this icon redirects you to the Instances section of the Service page, where you can monitor detailed health metrics such as CPU and memory usage for each instance.
Create new model node allows you to perform the following actions:

Open GitHub Code
It allows you to open the GitHub Code reference for the selected model. It will be unavailable if there is no fixed model selected.
- Open the Pipelines page and click on the pipeline from the list.
- Select the node from the pipeline.
- Click on the Action from the right-side panel.
- Click Open GitHub Code from the list. The GitHub page of the selected model is displayed.
Edit Service Settings
It allows you to make changes to the service settings like Integrations, Service Configuration, and Execution Configuration based on the model you have selected. This option is not available for Train and Validation.
You can now edit the service configuration of a node even while running a pipeline, providing greater flexibility.
- Open the Pipelines page and click on the pipeline from the list.
- Select the node from the pipeline.
- Click on the Action from the right-side panel.
- Click Edit Service Settings from the list. The Edit Service Setting popup window of the service is displayed.
Integrations
The secret values are displayed, if the secret is defined in the dpk/dpkConfig. Click on the Edit Secret to search and select a secret from the list.
- To create a new secret, click Create New -> Create Secret.
- To create a new Integration, click Create New -> Create Integration.
- Click Save Changes, if no additional modifications are needed.
Service Configuration
The service configuration section allows making changes to the following parameters, to change, click on the Edit Configuration.
- Machine Types: The machine type on which the service will run (refers to CPU, GPU, RAM).
- Change the machine type from the list.
- Click on the Machine Settings to enable Preemptible Machine, the reclaimable compute instances.
- Docker Image: A container image encapsulating essential dependencies and code for service execution. By default, the docker image based on the SDK version is displayed. You can modify the URL as required.
- Concurrency: Number of concurrent executions per instance. By default, the value 10 is displayed.
- Scaling Type: Choose the scaling type based on your workload.
- Autoscale: Recommended by default. Autoscaling dynamically adjusts the number of service instances based on the incoming execution load, suitable for changing workloads. When autoscaler reduces instances, it waits for execution timeout before termination.
Min Instances: By default, 0. If you set the min instances to 0, the service will not run until it has something in the queue, it will be suspended.Max Instances: By Default, 2.Queue Size: By default, 10.
- Fixed size: Use fixed scaling when you need a predetermined number of service instances, suitable for consistent workloads. Compute hours counts also when there is no workload. By default, 1 instance is selected.
- Autoscale: Recommended by default. Autoscaling dynamically adjusts the number of service instances based on the incoming execution load, suitable for changing workloads. When autoscaler reduces instances, it waits for execution timeout before termination.
- Click Save Changes, if no additional modifications are needed.
Execution Configuration
The execution configuration section allows making changes to the following parameters, to change, click on the Edit Configuration.
- SDK Version: The SDK version is displayed. Click to select a new version from the list.
- Execution Timeout: The maximum execution duration before service restarts (in seconds). By default, 3600 is displayed.
Drain Time: Delays service restart to complete ongoing executions (in seconds). By default, 600 is displayed.On Reset Action: Action taken when a service is reset or restarted (e.g. timeout). Select one of the following when you reset the execution.- Fail Execution
- Rerun Execution
Max Attempts: Configures to automatically retry failed executions up to x attempts. Maximum number of execution attempts allowed. By default, 3 is displayed.- Bot: A dummy user used for running the service ('developer' role). A default Bot is displayed. Select a new one from the list, if needed.
Rerun executions as process: Defines if each execution will start a new thread or a process. Enable to make the execution as a process.- Click Save Changes.
Edit Access Credentials
You can edit access credentials for models to easily select API keys for seamless application integration.
- Open the Pipelines page and click on the pipeline from the list.
- Select a model node from the pipeline.
- Click on the Action from the right-side panel.
- Click Edit Access Credentials from the list. The Set Credentials popup window is displayed.
- Select the API Key from the list.
- Click Confirm.
Copy the Node ID
Copy node ID of a pipeline node
- Open the Pipelines page and click on the pipeline from the list.
- Select the node from the pipeline.
- Click on the Action from the right-side panel.
- Click Copy Node ID from the list.
View Execution Details
It allows you to view the Executions page of the Application Service.
- Open the Pipelines page and click on the pipeline from the list.
- Select the node from the pipeline.
- Click on the Action from the right-side panel.
- Click View Executions from the list. The Executions tab of the CloudOps Service page is displayed.
View Log Details
It allows you to view the Logs page of the Application Service from a pipeline node.
- Open the Pipelines page and click on the pipeline from the list.
- Select the node from the pipeline.
- Click on the Action from the right-side panel.
- Click View Logs from the list. The Logs tab of the CloudOps page is displayed.
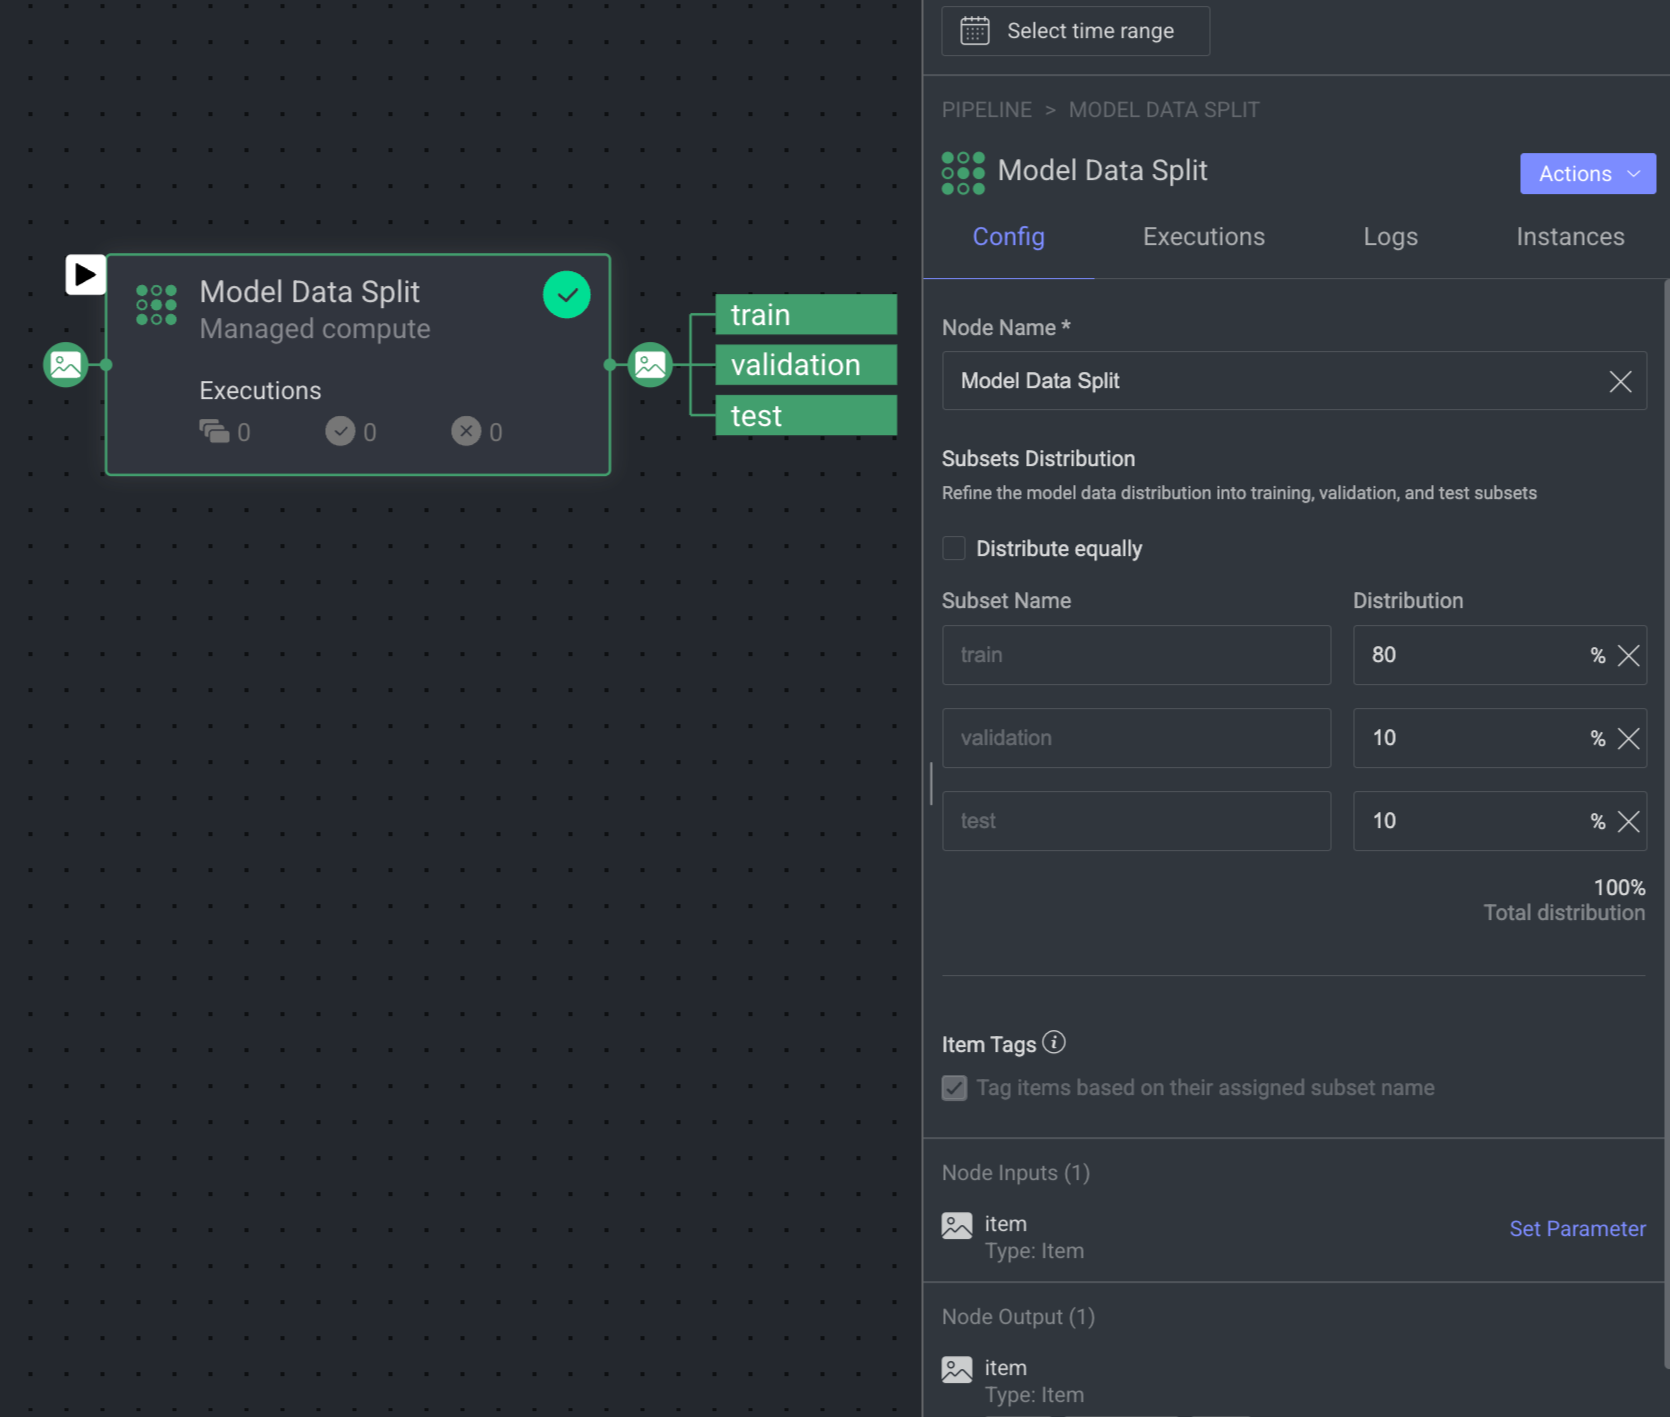
Model Data Split Node
The 'Model Data Split' node efficiently divides your data into training, validation, and test sets during runtime. You can define the distribution, and the node automatically assigns items to subsets using metadata tags for smooth data preparation.
The parameters that need defining are:
Node Name: Provide a name for the split node.
Subset Distribution: It allows you to distribute the data into train, validation, and test subsets.
(Optional) Distribute equally: Select the ☑️ check to split the data equally into the subsets.
Modify the distribution % if required.
Item Tags: By default, items are tagged based on their assigned subset name.
Input: By default, Type: Item is selected.
Output: By default, Type: Item is selected.
Trigger (Optional): An Event/Cron trigger can be set on this node, enabling you to initiate the pipeline run from this specific point.
When a node is selected, the Executions tab provides details about the execution of each item processed through that node.
- Choose a specific execution from the list to access its detailed information.
- Dataloop stores executions for a maximum of 90 days.
- Use the filter to display executions based on its status.
- Click Rerun Executions to rerun the selected executions. Before you confirm the rerun, you have two actions for the cycles:
- Resume Cycle: Resume the cycles of the selected executions starting from the current node onwards.
- Restart Cycle: Restart the cycles of the selected executions starting from the beginning.
- View Execution details such as Information, Input, and Output.
The Logs tab provides a granular view of what happens behind the scenes when a node executes.
- It showcases all log entries, including function and service level logs, application installation processes (from initialization to completion), generated during executions of the corresponding node within the selected time-frame.
- Dataloop stores logs for a maximum of 14 days.
- Click on the log to view log details in the bottom.
Utilize the following options to navigate through the logs:
- Search: Enter free text to search through the logs.
- Log Level Filter: Filter logs by selecting a level (critical, error, warning, info, debug) to find logs at that level and above.
- Show Service Logs: Show/hide service-level logs, aiding in the debugging and resolution of service-level errors and issues.
The Instance tab displays all available instances (replicas of services or machines) of the node service, along with their current status—such as 🟡 Initializing, 🟢 Running, or 🔴 Failed.
- It also indicates the number of restarts for each instance, which is useful for identifying services that are failing to activate and continuously restarting.
- Additionally, a monitoring icon is available for each instance. Clicking this icon redirects you to the Instances section of the Service page, where you can monitor detailed health metrics such as CPU and memory usage for each instance.
Model data split node allows you to perform the following actions:

Open GitHub Code
It allows you to open the GitHub Code reference for the selected model. It will be unavailable if there is no fixed model selected.
- Open the Pipelines page and click on the pipeline from the list.
- Select the node from the pipeline.
- Click on the Action from the right-side panel.
- Click Open GitHub Code from the list. The GitHub page of the selected model is displayed.
Edit Service Settings
It allows you to make changes to the service settings like Integrations, Service Configuration, and Execution Configuration based on the model you have selected. This option is not available for Train and Validation.
You can now edit the service configuration of a node even while running a pipeline, providing greater flexibility.
- Open the Pipelines page and click on the pipeline from the list.
- Select the node from the pipeline.
- Click on the Action from the right-side panel.
- Click Edit Service Settings from the list. The Edit Service Setting popup window of the service is displayed.
Integrations
The secret values are displayed, if the secret is defined in the dpk/dpkConfig. Click on the Edit Secret to search and select a secret from the list.
- To create a new secret, click Create New -> Create Secret.
- To create a new Integration, click Create New -> Create Integration.
- Click Save Changes, if no additional modifications are needed.
Service Configuration
The service configuration section allows making changes to the following parameters, to change, click on the Edit Configuration.
- Machine Types: The machine type on which the service will run (refers to CPU, GPU, RAM).
- Change the machine type from the list.
- Click on the Machine Settings to enable Preemptible Machine, the reclaimable compute instances.
- Docker Image: A container image encapsulating essential dependencies and code for service execution. By default, the docker image based on the SDK version is displayed. You can modify the URL as required.
- Concurrency: Number of concurrent executions per instance. By default, the value 10 is displayed.
- Scaling Type: Choose the scaling type based on your workload.
- Autoscale: Recommended by default. Autoscaling dynamically adjusts the number of service instances based on the incoming execution load, suitable for changing workloads. When autoscaler reduces instances, it waits for execution timeout before termination.
Min Instances: By default, 0. If you set the min instances to 0, the service will not run until it has something in the queue, it will be suspended.Max Instances: By Default, 2.Queue Size: By default, 10.
- Fixed size: Use fixed scaling when you need a predetermined number of service instances, suitable for consistent workloads. Compute hours counts also when there is no workload. By default, 1 instance is selected.
- Autoscale: Recommended by default. Autoscaling dynamically adjusts the number of service instances based on the incoming execution load, suitable for changing workloads. When autoscaler reduces instances, it waits for execution timeout before termination.
- Click Save Changes, if no additional modifications are needed.
Execution Configuration
The execution configuration section allows making changes to the following parameters, to change, click on the Edit Configuration.
- SDK Version: The SDK version is displayed. Click to select a new version from the list.
- Execution Timeout: The maximum execution duration before service restarts (in seconds). By default, 3600 is displayed.
Drain Time: Delays service restart to complete ongoing executions (in seconds). By default, 600 is displayed.On Reset Action: Action taken when a service is reset or restarted (e.g. timeout). Select one of the following when you reset the execution.- Fail Execution
- Rerun Execution
Max Attempts: Configures to automatically retry failed executions up to x attempts. Maximum number of execution attempts allowed. By default, 3 is displayed.- Bot: A dummy user used for running the service ('developer' role). A default Bot is displayed. Select a new one from the list, if needed.
Rerun executions as process: Defines if each execution will start a new thread or a process. Enable to make the execution as a process.- Click Save Changes.
Edit Access Credentials
You can edit access credentials for models to easily select API keys for seamless application integration.
- Open the Pipelines page and click on the pipeline from the list.
- Select a model node from the pipeline.
- Click on the Action from the right-side panel.
- Click Edit Access Credentials from the list. The Set Credentials popup window is displayed.
- Select the API Key from the list.
- Click Confirm.
Copy the Node ID
Copy node ID of a pipeline node
- Open the Pipelines page and click on the pipeline from the list.
- Select the node from the pipeline.
- Click on the Action from the right-side panel.
- Click Copy Node ID from the list.
View Execution Details
It allows you to view the Executions page of the Application Service.
- Open the Pipelines page and click on the pipeline from the list.
- Select the node from the pipeline.
- Click on the Action from the right-side panel.
- Click View Executions from the list. The Executions tab of the CloudOps Service page is displayed.
View Log Details
It allows you to view the Logs page of the Application Service from a pipeline node.
- Open the Pipelines page and click on the pipeline from the list.
- Select the node from the pipeline.
- Click on the Action from the right-side panel.
- Click View Logs from the list. The Logs tab of the CloudOps page is displayed.
Model Application Nodes
Model application nodes in DDOE's pipeline allow flexible interaction with machine learning models. They provide an interface to perform various operations, like prediction, generation, or embedding, and adapt easily to different tasks in your workflow without reconfiguring the model.
Predict Operation: This function is typically used for generating outputs based on new input data. For example, if your model is designed for image classification, the "Predict" operation would produce the most likely category or label for a given image.
Embed Operation: This function is used to create embeddings, which are compact, numerical representations of input data. These embeddings can be useful for various tasks, including clustering, similarity search, or as inputs to other models for more complex processing.
Generative AI Operation: The Generative AI Operation refers to the functionality within a machine learning model that is specifically designed to create new, original content rather than merely analyzing or predicting outcomes based on existing data.
Install model application nodes: You can add Dynamic Model Nodes by clicking the Plus icon on the left-side panel and install them from the marketplace model library. If needed, you can also remove them from the list at any time.
Embeddings Nodes
The Model application embeddings nodes are the shortcuts in the pipelines that provide a convenient way to interact with ML Embeddings models. It allows users to quickly choose and apply different operations that the model supports, such as Predict or Embed.
When configuring these nodes, you will find an Operation field in the Node Configuration tab. This field allows you to select which operation you'd like the node to perform. If the ML model you're working with supports both Predict and Embed operations, the Predict operation will be selected by default. However, you can manually switch to the Embed operation if that better suits your needs.
Model application embeddings' node allows you to perform the following actions:
Open GitHub Code
It allows you to open the GitHub Code reference for the selected model. It will be unavailable if there is no fixed model selected.
- Open the Pipelines page and click on the pipeline from the list.
- Select the node from the pipeline.
- Click on the Action from the right-side panel.
- Click Open GitHub Code from the list. The GitHub page of the selected model is displayed.
Edit Service Settings
It allows you to make changes to the service settings like Integrations, Service Configuration, and Execution Configuration based on the model you have selected. This option is not available for Train and Validation.
You can now edit the service configuration of a node even while running a pipeline, providing greater flexibility.
- Open the Pipelines page and click on the pipeline from the list.
- Select the node from the pipeline.
- Click on the Action from the right-side panel.
- Click Edit Service Settings from the list. The Edit Service Setting popup window of the service is displayed.
Integrations
The secret values are displayed, if the secret is defined in the dpk/dpkConfig. Click on the Edit Secret to search and select a secret from the list.
- To create a new secret, click Create New -> Create Secret.
- To create a new Integration, click Create New -> Create Integration.
- Click Save Changes, if no additional modifications are needed.
Service Configuration
The service configuration section allows making changes to the following parameters, to change, click on the Edit Configuration.
- Machine Types: The machine type on which the service will run (refers to CPU, GPU, RAM).
- Change the machine type from the list.
- Click on the Machine Settings to enable Preemptible Machine, the reclaimable compute instances.
- Docker Image: A container image encapsulating essential dependencies and code for service execution. By default, the docker image based on the SDK version is displayed. You can modify the URL as required.
- Concurrency: Number of concurrent executions per instance. By default, the value 10 is displayed.
- Scaling Type: Choose the scaling type based on your workload.
- Autoscale: Recommended by default. Autoscaling dynamically adjusts the number of service instances based on the incoming execution load, suitable for changing workloads. When autoscaler reduces instances, it waits for execution timeout before termination.
Min Instances: By default, 0. If you set the min instances to 0, the service will not run until it has something in the queue, it will be suspended.Max Instances: By Default, 2.Queue Size: By default, 10.
- Fixed size: Use fixed scaling when you need a predetermined number of service instances, suitable for consistent workloads. Compute hours counts also when there is no workload. By default, 1 instance is selected.
- Autoscale: Recommended by default. Autoscaling dynamically adjusts the number of service instances based on the incoming execution load, suitable for changing workloads. When autoscaler reduces instances, it waits for execution timeout before termination.
- Click Save Changes, if no additional modifications are needed.
Execution Configuration
The execution configuration section allows making changes to the following parameters, to change, click on the Edit Configuration.
- SDK Version: The SDK version is displayed. Click to select a new version from the list.
- Execution Timeout: The maximum execution duration before service restarts (in seconds). By default, 3600 is displayed.
Drain Time: Delays service restart to complete ongoing executions (in seconds). By default, 600 is displayed.On Reset Action: Action taken when a service is reset or restarted (e.g. timeout). Select one of the following when you reset the execution.- Fail Execution
- Rerun Execution
Max Attempts: Configures to automatically retry failed executions up to x attempts. Maximum number of execution attempts allowed. By default, 3 is displayed.- Bot: A dummy user used for running the service ('developer' role). A default Bot is displayed. Select a new one from the list, if needed.
Rerun executions as process: Defines if each execution will start a new thread or a process. Enable to make the execution as a process.- Click Save Changes.
Edit Access Credentials
You can edit access credentials for models to easily select API keys for seamless application integration.
- Open the Pipelines page and click on the pipeline from the list.
- Select a model node from the pipeline.
- Click on the Action from the right-side panel.
- Click Edit Access Credentials from the list. The Set Credentials popup window is displayed.
- Select the API Key from the list.
- Click Confirm.
Open the Model Page
It allows you to open the model that has been referenced. It will be unavailable if there is no model reference.
- Open the Pipelines page and click on the pipeline from the list.
- Select the node from the pipeline.
- Click on the Action from the right-side panel.
- Click Open Model from the list. The Model's Details page is displayed.
Copy the Node ID
Copy node ID of a pipeline node
- Open the Pipelines page and click on the pipeline from the list.
- Select the node from the pipeline.
- Click on the Action from the right-side panel.
- Click Copy Node ID from the list.
View Execution Details
It allows you to view the Executions page of the Application Service.
- Open the Pipelines page and click on the pipeline from the list.
- Select the node from the pipeline.
- Click on the Action from the right-side panel.
- Click View Executions from the list. The Executions tab of the CloudOps Service page is displayed.
View Log Details
It allows you to view the Logs page of the Application Service from a pipeline node.
- Open the Pipelines page and click on the pipeline from the list.
- Select the node from the pipeline.
- Click on the Action from the right-side panel.
- Click View Logs from the list. The Logs tab of the CloudOps page is displayed.
Generative Model
The Model application generate nodes are the shortcuts in the pipelines that provide a convenient way to interact with ML Generative models. It allows users to quickly select and apply different operations that the model supports, such as Generate or Embed.
When configuring these nodes, you will find an Operation field in the Node Configuration tab. This field allows you to select which operation you'd like the node to perform. If the ML model you're working with supports both Generate and Embed operations, the Generate operation will be selected by default. However, you can manually switch to the Embed operation if that better suits your needs.
Dynamic generative node allows you to perform the following actions:
Open GitHub Code
It allows you to open the GitHub Code reference for the selected model. It will be unavailable if there is no fixed model selected.
- Open the Pipelines page and click on the pipeline from the list.
- Select the node from the pipeline.
- Click on the Action from the right-side panel.
- Click Open GitHub Code from the list. The GitHub page of the selected model is displayed.
Edit Service Settings
It allows you to make changes to the service settings like Integrations, Service Configuration, and Execution Configuration based on the model you have selected. This option is not available for Train and Validation.
You can now edit the service configuration of a node even while running a pipeline, providing greater flexibility.
- Open the Pipelines page and click on the pipeline from the list.
- Select the node from the pipeline.
- Click on the Action from the right-side panel.
- Click Edit Service Settings from the list. The Edit Service Setting popup window of the service is displayed.
Integrations
The secret values are displayed, if the secret is defined in the dpk/dpkConfig. Click on the Edit Secret to search and select a secret from the list.
- To create a new secret, click Create New -> Create Secret.
- To create a new Integration, click Create New -> Create Integration.
- Click Save Changes, if no additional modifications are needed.
Service Configuration
The service configuration section allows making changes to the following parameters, to change, click on the Edit Configuration.
- Machine Types: The machine type on which the service will run (refers to CPU, GPU, RAM).
- Change the machine type from the list.
- Click on the Machine Settings to enable Preemptible Machine, the reclaimable compute instances.
- Docker Image: A container image encapsulating essential dependencies and code for service execution. By default, the docker image based on the SDK version is displayed. You can modify the URL as required.
- Concurrency: Number of concurrent executions per instance. By default, the value 10 is displayed.
- Scaling Type: Choose the scaling type based on your workload.
- Autoscale: Recommended by default. Autoscaling dynamically adjusts the number of service instances based on the incoming execution load, suitable for changing workloads. When autoscaler reduces instances, it waits for execution timeout before termination.
Min Instances: By default, 0. If you set the min instances to 0, the service will not run until it has something in the queue, it will be suspended.Max Instances: By Default, 2.Queue Size: By default, 10.
- Fixed size: Use fixed scaling when you need a predetermined number of service instances, suitable for consistent workloads. Compute hours counts also when there is no workload. By default, 1 instance is selected.
- Autoscale: Recommended by default. Autoscaling dynamically adjusts the number of service instances based on the incoming execution load, suitable for changing workloads. When autoscaler reduces instances, it waits for execution timeout before termination.
- Click Save Changes, if no additional modifications are needed.
Execution Configuration
The execution configuration section allows making changes to the following parameters, to change, click on the Edit Configuration.
- SDK Version: The SDK version is displayed. Click to select a new version from the list.
- Execution Timeout: The maximum execution duration before service restarts (in seconds). By default, 3600 is displayed.
Drain Time: Delays service restart to complete ongoing executions (in seconds). By default, 600 is displayed.On Reset Action: Action taken when a service is reset or restarted (e.g. timeout). Select one of the following when you reset the execution.- Fail Execution
- Rerun Execution
Max Attempts: Configures to automatically retry failed executions up to x attempts. Maximum number of execution attempts allowed. By default, 3 is displayed.- Bot: A dummy user used for running the service ('developer' role). A default Bot is displayed. Select a new one from the list, if needed.
Rerun executions as process: Defines if each execution will start a new thread or a process. Enable to make the execution as a process.- Click Save Changes.
Edit Access Credentials
You can edit access credentials for models to easily select API keys for seamless application integration.
- Open the Pipelines page and click on the pipeline from the list.
- Select a model node from the pipeline.
- Click on the Action from the right-side panel.
- Click Edit Access Credentials from the list. The Set Credentials popup window is displayed.
- Select the API Key from the list.
- Click Confirm.
Open the Model Page
It allows you to open the model that has been referenced. It will be unavailable if there is no model reference.
- Open the Pipelines page and click on the pipeline from the list.
- Select the node from the pipeline.
- Click on the Action from the right-side panel.
- Click Open Model from the list. The Model's Details page is displayed.
Copy the Node ID
Copy node ID of a pipeline node
- Open the Pipelines page and click on the pipeline from the list.
- Select the node from the pipeline.
- Click on the Action from the right-side panel.
- Click Copy Node ID from the list.
View Execution Details
It allows you to view the Executions page of the Application Service.
- Open the Pipelines page and click on the pipeline from the list.
- Select the node from the pipeline.
- Click on the Action from the right-side panel.
- Click View Executions from the list. The Executions tab of the CloudOps Service page is displayed.
View Log Details
It allows you to view the Logs page of the Application Service from a pipeline node.
- Open the Pipelines page and click on the pipeline from the list.
- Select the node from the pipeline.
- Click on the Action from the right-side panel.
- Click View Logs from the list. The Logs tab of the CloudOps page is displayed.