Structuring your items within a dataset is key to maintaining clarity and efficiency as your projects grow. Efficient data organization is critical for streamlining dataset management, enhancing searchability, and improving collaboration. Dataloop’s Data Browser provides structured ways to manage and access data using Folders, Collections, Metadata, and ML Subsets.
Folders
In Dataloop, folders offer a straightforward way to organize unstructured data by grouping related items together. This hierarchical structure makes it easier to navigate large datasets, manage different data types, and keep your workspace tidy.
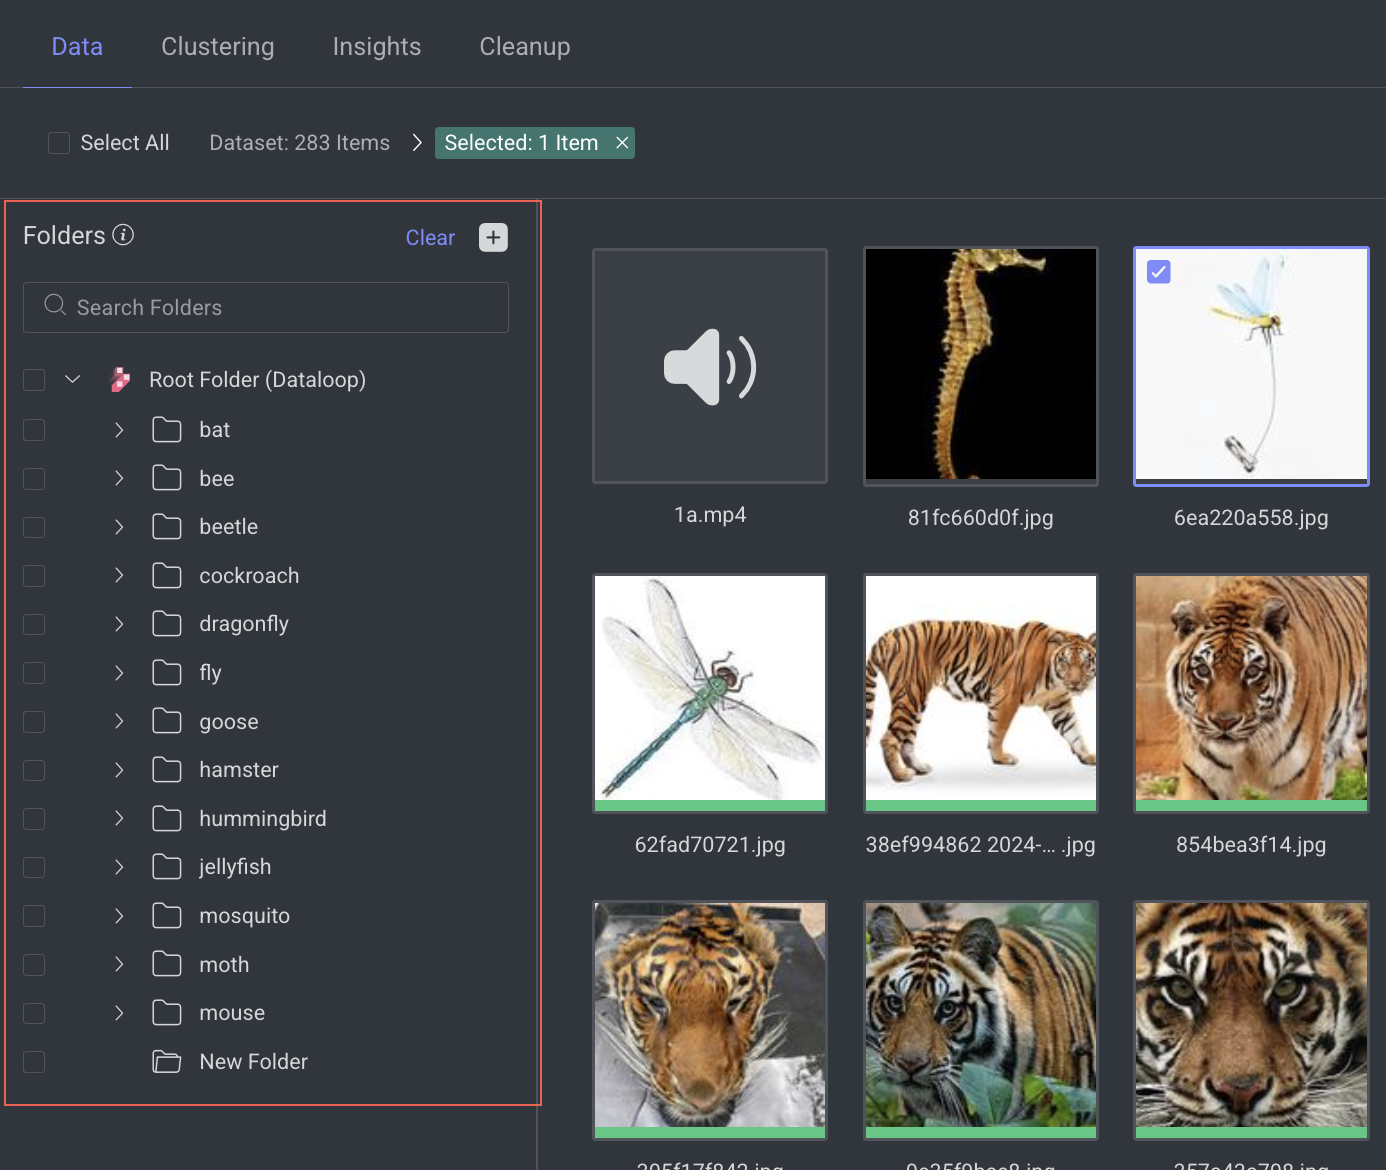
Access Folders
The left panel in the dataset browser provides quick access to your folder structure. When the panel is collapsed, a folder icon appears, allowing you to reopen the panel and continue browsing your dataset.
It shows items based on the folders or subfolders you selected. When you select the Root Folder, it shows items and folders if available in the Root folder.
Create Folders
Create folders: Select the root folder and click on the plus icon or the New Folder icon when you hover Root Folder (Dataloop).
Create Subfolder: Select the folder and click New Folder icon or the new folder icon when you hover the selected folder.
Filter By Folders
Quickly filter you data using the Folder tree component:
Select a folder and all its subfolders by clicking the checkbox next to the folder.
Click on the folder name to select the folder itself only.
Selected folders are automatically applied in the browser filters.
Move Items Between Folders
1. Select one or more items from the current page.
2. Right-click and select File Actions > Move to Folder.
3. Select the folder from the list.
4. Click Move.
Rename Folder
Hover over the folder, and click on the folder edit icon.
Collections
The Collections feature in Dataloop's Data Browser helps organize data by allowing you to group specific sets of items based on task needs (e.g., annotation, review, training) into a collection folder. You can create up to 10 collection folders.
.png)
Key Features of Collections in Data Browser
Selective Grouping: Choose specific items from a dataset to move into a collection based on criteria like image type, labeling status, or annotation requirements.
Easy Access:
Collections provide a convenient way to quickly access and manage items that are organized in collection folders for relevant to a particular task, without sifting through the entire dataset.
Collections allows you to identify the list of Unassigned Items (the items that are not yet part of any collections).
Enhanced Collaboration: Collections can be shared with team members, allowing specific data subsets to be easily shared and collaboratively worked on without impacting the primary dataset.
Task-Specific Organization: Create collections based on different stages of your workflow, like "Pending Annotation," "Quality Review," or "Model Training Set," which helps keep the data organized according to your project’s progress.
Filter Collection Items Using Smart Search: Use the Items field in the smart search to apply a collection filter query to find specific items within a collection. For instance, using the query
metadata.system.collections.c0 = truewill filter items that are part of the first collection (.c0ID for the firstly created collection folder and.c9ID for the lastly created collection folder).
Create Collections
Creating Collections can be customized to match the requirements of your specific task, such as grouping items by type, project phase, or other relevant attributes.
Limitations:
- You can create up to 10 collection folders.
- Each item can be tagged in a maximum of 10 collections at once.
Open the Data Browser.
Click on the Collections button located below of the Dataset name.
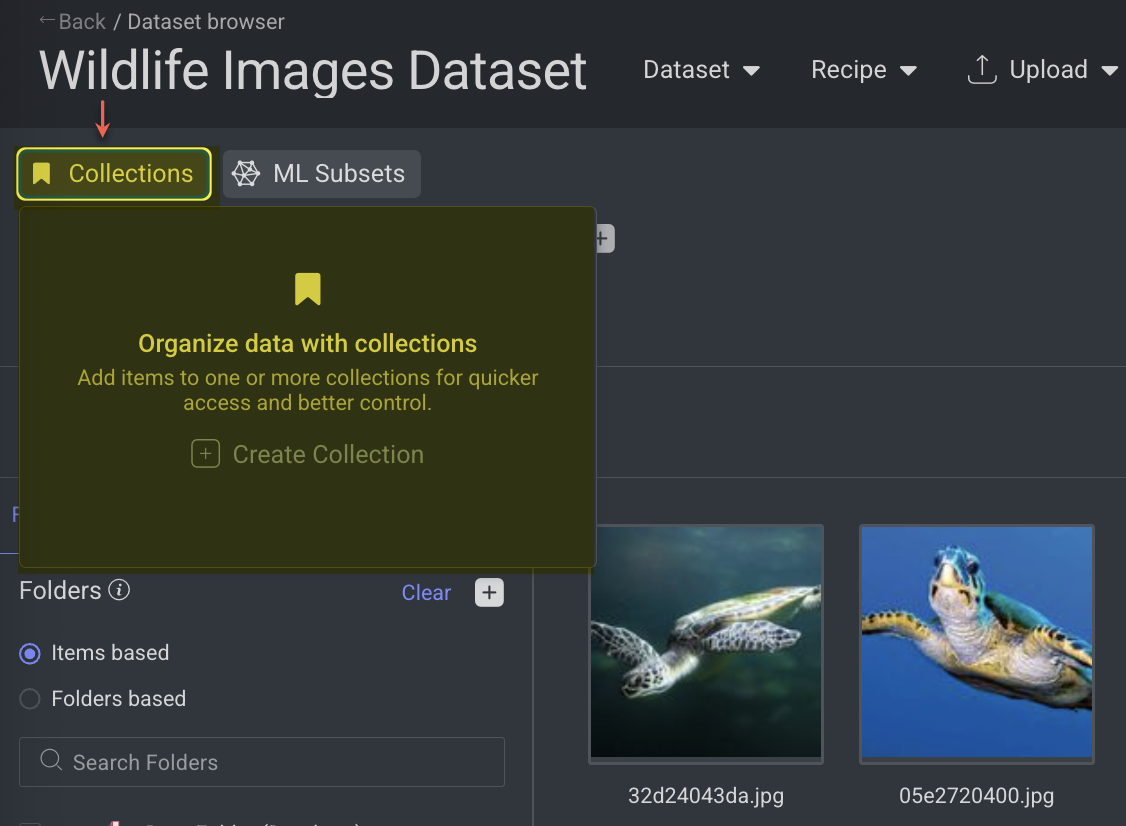
Click on Create Collection.
Type your desired collection's name, and press the Enter key. The new collection will now be created and displayed in Collections.
Access Collections
To access the Collections in the Data Browser:
Open the Data Browser: Log in to your Dataloop account and navigate to the Data Browser.
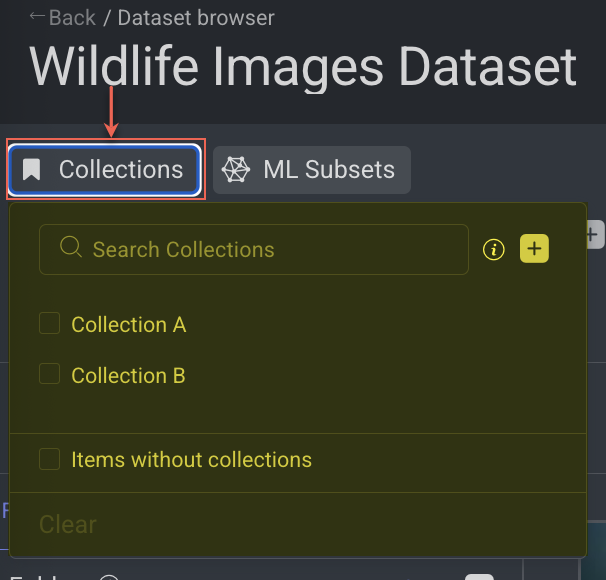
Click on the Collections button situated below the Datasets name. A popup will display with all your existing collections, an option to choose Items without collections, and allowing you to create new ones or manage current collections as needed.
Add Items to a Collection
You can create a new collection by selecting items from your dataset and adding them to a designated collection.
Open the Data Browser.
Select the items you want to add to a collection.
Right-click on the selected items.
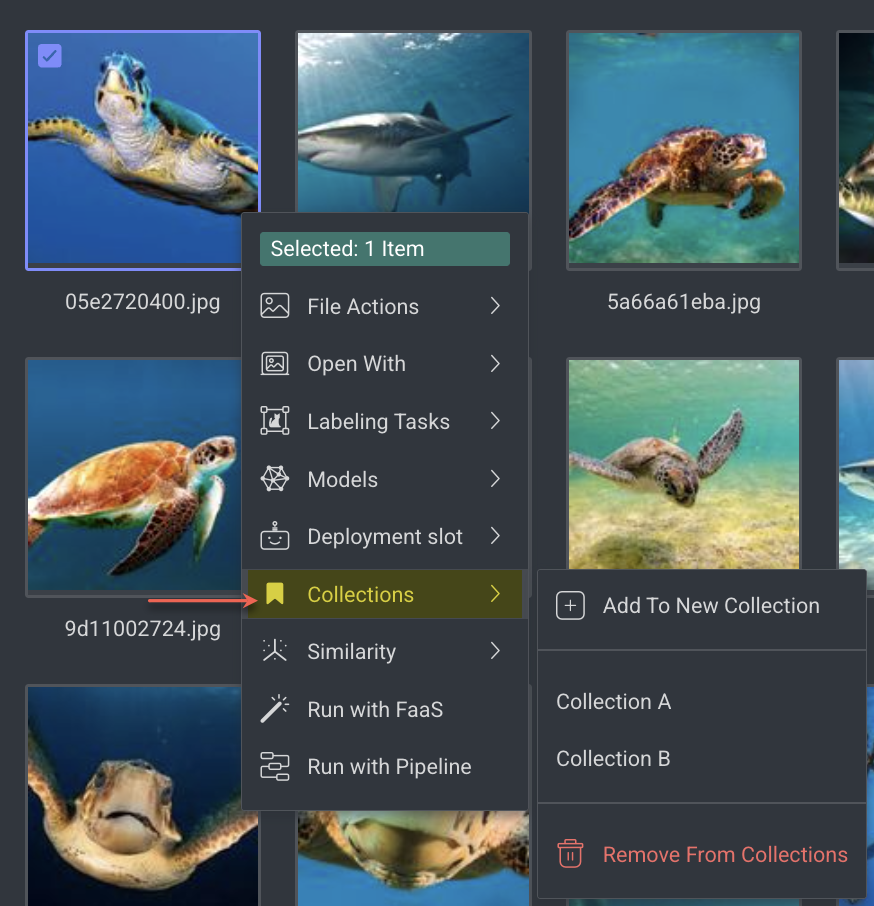
Select Collections and choose your desired collection. The selected items will now be added to the chosen collection.
Find Collections Using Smart Search
Open the Data Browser.
Click on the Items search field.
Enter the query code as
metadata.system.collections.c0 = truewhere c0 is collection ID. The available collections will be listed as a dropdown.
Clone Collections
Open the Data Browser: Log in to your Dataloop account and navigate to the Data Browser.
Click on the Collections button situated below the Datasets name.
Hover-over the collection you want to clone.
Click on the three dots and select Clone from the list.
Click to confirm the cloning process. The cloned collection will be created and named as
original_name-clone-1.
Rename Collections
Open the Data Browser: Log in to your Dataloop account and navigate to the Data Browser.
Click on the Collections button situated below the Datasets name.
Hover-over the collection that to be renamed.
Click on the three dots and select Rename from the list.
Make the changes and press Enter key.
Remove Items from Collections
Open the Data Browser.
Click on the Collections button situated below the Datasets name.
Click on the collection containing the items you want to remove.
Select the items, then right-click on them.
Select Collections -> Remove From Collections option from the list.
Select the specific collection from which you want to remove the items (if they belong to multiple collections).
Click . A successful deletion message will be displayed.
Remove Collection from Items
Open the Data Browser.
Select Item(s) from the browser.
Right-click and select Collections -> Remove from Collections.
Select the Collection(s) that are to be removed.
Click . A confirmation message is displayed.
Delete Collections
Open the Data Browser.
Click on the Collections button situated below the Datasets name.
Hover-over the collection you want to delete.
Click on the three dots and select Delete from the list.
Click to confirm the deletion process.
SDK Code to Manage Collections
Leverage the Dataloop SDK to create, update, delete, and manage collections at both the dataset and item levels.
ML Subsets
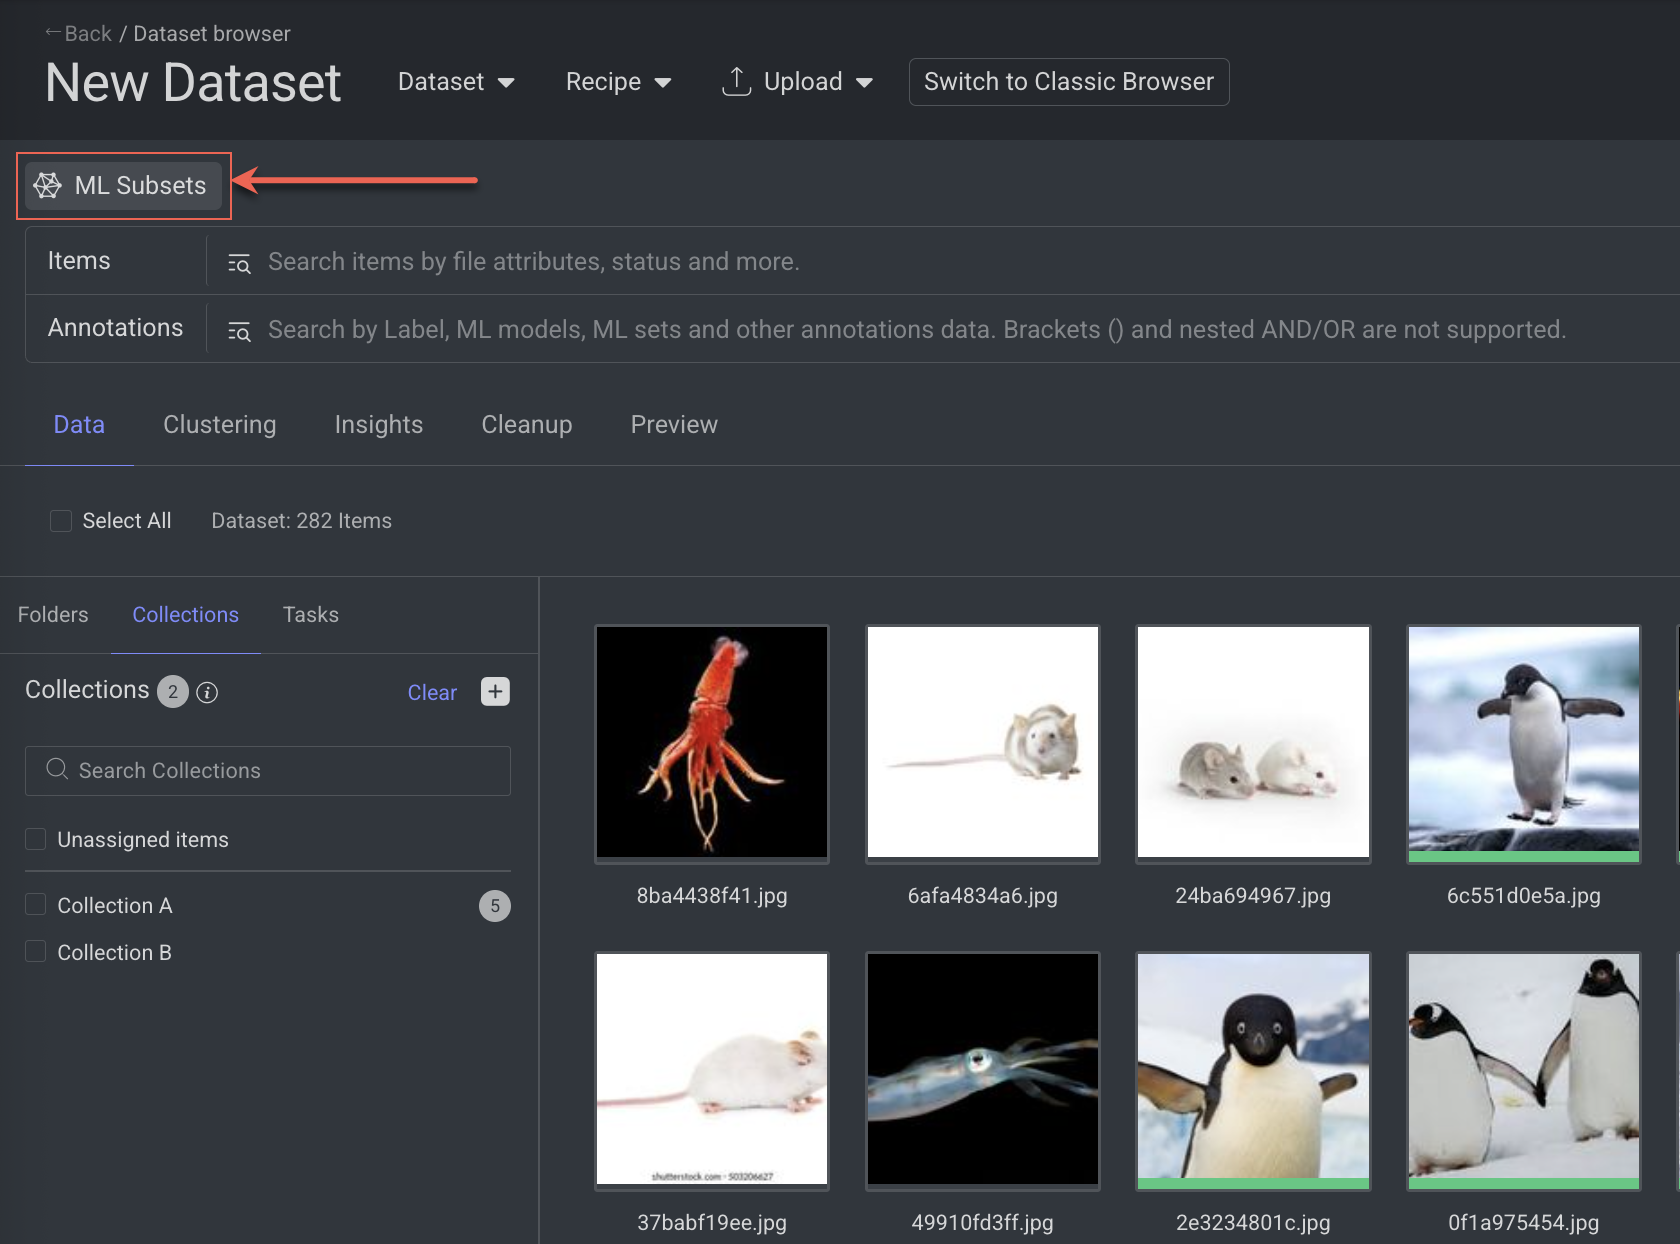
The ML Subsets view in Dataloop’s Data Browser is a dedicated feature that streamlines machine learning workflows by helping you organize and manage datasets more efficiently. It enables you to classify and filter items according to their ML subset assignments—such as train, validation, and test—which are essential stages in the ML lifecycle for model development and evaluation.
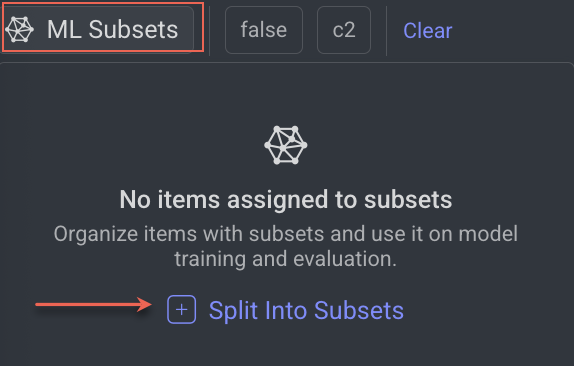
When you click on ML Subsets, a popup menu appears. From here, you can select Split Into Subsets to assign items to the desired subsets.
Filtering by ML Subset Assignment:
Easily locate items in your dataset based on their subset classification:
Train: Items designated for training the ML model.
Validation: Items used to tune hyperparameters and evaluate the model during training.
Test: Items reserved for final evaluation of the trained model's performance.
Unassigned: Items that have not been allocated to any specific subset.
Use Cases:
Training Pipeline: Quickly access the train subset to prepare data for model training.
Model Validation: Focus on the validation subset to monitor the model’s performance during tuning.
Final Testing: Access the test subset to evaluate the final accuracy, precision, or other metrics.
Select and right-click on any item from the folders and perform actions available.
ML Data Split Chart
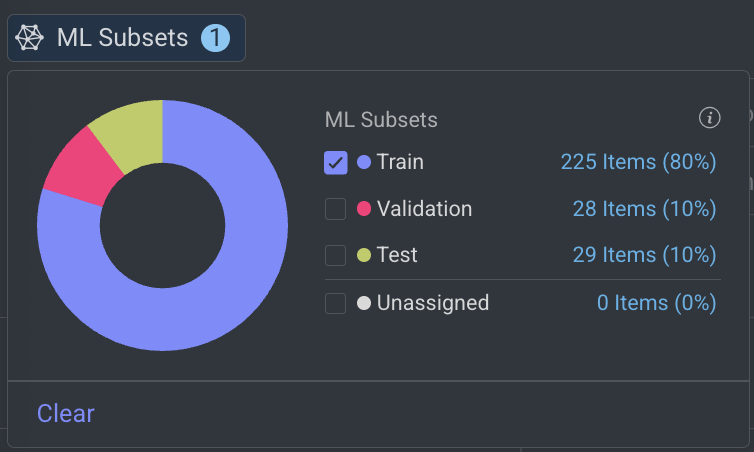
ML Data Split Chart displays the distribution of items across machine learning subsets, including Test, Train, and Validation, showing both the total numbers and percentages.
This chart is generated when an item is assigned to one of the ML subsets.
When hovering over a subset, the chart specifically highlights the subset being hovered over.
Clicking on a subset grays it out, removing it from the chart.
Clicking on it again restores its visibility on the chart.
Why Use the ML Subsets View?
It simplifies dataset management by clearly segregating data for training, validation, and testing, reducing errors in ML workflows.
Enhances collaboration within teams by providing a consistent structure for dataset organization.
Saves time by offering intuitive filtering and search options for specific subsets.
View Items by ML Subsets
Go to the Data Browser.
Select the ML Subsets from the top-bar. The available items are displayed in folder wise.
Select a subset. For example, Train, etc. and click outside of the ML Subsets pop-up. The items are added to the train subset will be filtered and displayed.

A search query for the train subsets will be also added and visible on the Items search field.

If there are no items added to ML Subsets, click Split Into Subsets.
Split Items Into Subsets
Split Data Into Subsets feature allows users to divide their dataset into multiple subsets, such as train, validation, and test, based on a specified distribution. This splitting is important for ensuring that the dataset is well-prepared for machine learning or data analysis tasks. Custom Distribution: By default, the items are divided as follows:
Train set: 80% of the data, which is used to train the machine learning model.
Validation set: 10% of the data, which is used during training to fine-tune model hyperparameters and prevent overfitting.
Test set: 10% of the data, which is used to evaluate the final model performance after training.
In the Dataset Browser, select one or more items.
Click .
Select Models -> Split Into Subsets. The ML Data Split pop-up is displayed.
Customize the distribution by moving the slider. By default, the items are divided as mentioned above.
Click . A confirmation message is displayed, and the selected items are divided into respective subsets.
Click on the ML Data Split section in the right-side panel to view the items' distribution.
SDK Code to Manage ML Subsets
This SDK code demonstrates how to filter dataset items, split them into ML subsets, assign specific items to a subset, remove an item from a subset, and retrieve items missing an ML subset in Dataloop.
Metadata
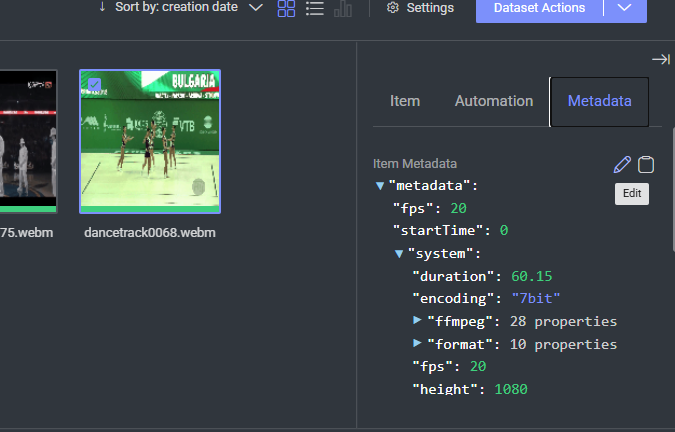
Item metadata consists of descriptive information and attributes associated with individual items in a dataset. Dataloop enables users to organize and categorize data items using metadata tags, making it easier to filter and analyze datasets efficiently.
With metadata-based filtering, users can define Filter Queries to refine searches based on specific attributes, such as field names or annotation labels. For example, a query can be created to filter items based on a particular metadata field or assigned annotations.
You can update item metadata using either the UI or SDK allowing for efficient querying and retrieval of relevant data when needed.
Add Custom Metadata
Adding custom metadata involves attaching additional information or tags to various types of data items. Custom metadata can be user-defined and is not limited to the predefined categories or attributes provided by the Dataloop platform.
To attach metadata to any entity, such as Datasets, you can utilize the SDK's 'Update' function. To learn how to upload items with metadata, read here.
// Example
dataset.metadata["MyBoolean"] = True
dataset.metadata["Mycontext"] = Blue
dataset.update()
Display Custom Metadata
The datasets page provides a list of all the datasets present within the project. The table contains default columns, including dataset name, the count of items, the percentage of annotated items, and additional information.
To include and display columns with your custom context (metadata fields):
From the Project Overview, click on Settings.
Select Configuration.
Select the Dataset Columns from the left-side menu.
Click .
Click .
Enter the required information as follows.
Name: A general name for this column (not visible outside the project-settings).
Label: The column header displayed on the Datasets page.
Field: The Metadata field to map to this column.
Configure the desired feature settings as needed:
Link: If the field value is a URL and should open in a new tab, select this option.
Resizable: Check this option if the column needs to be resizable, useful for displaying long values.
Sortable: Enable this option to allow sorting the table by clicking the column header.
Click . A successful message is displayed.
After completing the above steps, the Datasets table on the Datasets page will display the custom column and the data you've populated there.
To ensure that any new data added via SDK is reflected, refresh the page.
You can use the search box to search for datasets that match your search term, provided that the search term is included in any of the custom columns you've added to the table. This allows you to filter datasets based on the custom metadata you've defined.
Searchable Metadata
Searchable metadata refers to key-value pairs stored under metadata.user that are indexed by Dataloop, enabling:
Filtering via DQL (Dataloop Query Language)
Searching via schema-based search
These indexed keys are automatically available for use in UI filters, API queries, and pipeline automation conditions.
How It's Created
Automatically indexed when new metadata is added to items (manually or via upload/sync), up to the platform limit (100 searchable keys per dataset).
By default, all new keys are assumed searchable until the searchable limit is reached.
Limitations of Searchable Metadata
Constraint | Description |
|---|---|
Max Keys | 100 searchable keys per dataset under |
Indexing Scope | Only metadata under |
First 100 Keys | Only the first 100 unique keys across all items are indexed. |
Schema Overflow Error | Adding a 101st searchable key blocks item upload with a backend error. |
Unsearchable Metadata
Unsearchable metadata in Dataloop refers to custom key-value pairs stored under alternative subpaths like metadata.user.unsearchable, which are not indexed by the platform.
Key Behaviors
Visible in the Dataloop UI — including the dataset browser, item view, and Studio
Not searchable or filterable using DQL, schema-based search, or automation conditions
Handling Identical Keys: Identical keys can be added to the unsearchable path if one of them is nested. For example,
metadata.user.event_data.companyTypeandmetadata.user.companyType.Inherited Unsearchable Paths: When a parent path (like
metadata.user.*) is marked as unsearchable, it automatically applies to all of its child fields (such asmetadata.user.event_data.notes).This means you don’t need to explicitly add every subfield under that parent — once the parent is marked unsearchable, the entire branch of fields becomes unsearchable by inheritance.
Ideal for contextual tagging without consuming searchable schema slots
Any key listed in
unsearchablePathswill not be indexed or searchableThese keys remain fully visible at the item level, accessible to annotators and developers
unsearchablePathsare prefix-based — all nested keys under the specified prefix are also unsearchableRemoving a path from
unsearchablePathswill restore searchability for existing data under that pathMaximum of 200 searchable keys per dataset
When to Use Unsearchable Metadata
Unsearchable metadata is particularly useful for:
Supplementing annotation context (e.g., hints or descriptions for annotators)
Storing descriptive or trace information (e.g., user notes, collection metadata)
Avoiding schema overflow caused by exceeding searchable metadata limits
Practical Example:
When annotating turtle images, storing the location (e.g., "region": "Pacific Ocean") as unsearchable metadata helps annotators infer species without using up one of the 100 (use up to 200) searchable key slots.
This feature empowers users to manage schema complexity while maintaining metadata visibility and usability in non-query contexts.
Before Adding Keys to Unsearchable Paths
Ensure the following criteria are met before adding any keys:
Language Compliance
The metadata fields must be in English.
Fields containing non-English characters or text should be reviewed and standardized before inclusion.
Character Restrictions
Metadata must not include special or non-printable characters such as:
Curly quotes (“ ”) or other non-standard quotation marks
Single quotes (')
Escape characters such as
\t(tab) or\n(newline)
Make the Metadata Key Unsearchable
You will learn how to retrieve the dataset schema, mark specific keys as unsearchable, and revert them to searchable.
It helps you to overcome the errors received on metadata while uploading items.
Important
When you add or remove an unsearchable path, it triggers re-indexing. During this process, schema changes and new metadata additions are temporarily disabled until indexing is complete.
Step 1: Connect to the Dataloop Platform
Sets the environment to production (for example) and logs in using your configured credentials.
import dtlpy as dl
dl.setenv("prod")
dl.login()
Step 2: Access the Dataset and Target Item
Retrieve the specific dataset and item by ID.
dataset = dl.datasets.get(dataset_id='your_dataset_id')
item = dataset.items.get(item_id='your_item_id')
Step 3: Add Metadata Keys
# Add professional, descriptive metadata keys under 'metadata.user'
item.metadata['user'] = dict()
item.metadata['user'] = {
    "review_notes": "Animal partially occluded, needs double check",
    "source_device_id": "trailcam_09"
}
# Save the changes to the item
item = item.update()
Adds a metadata keys:
review_notesand with valueAnimal partially occluded, needs double checkundermetadata.usersource_device_idand with valuetrailcam_09undermetadata.user
Updates the item so the new metadata is saved.
Step 4: Access Project and Dataset Schema
Retrieve the project and then the dataset again through the project object.
# Access the project using the project ID
project = dl.projects.get(project_id='e85578a0-a453-4fbd-a2b2-7f90739cbf66')
# Re-fetch the dataset through the project context
dataset_from = project.datasets.get(dataset_id=dataset.id)
Step 5: Make Keys Unsearchable
# Add keys to unsearchablePaths to prevent them from being indexed
success = dataset.schema.unsearchable_paths.add(paths=[
    "metadata.user.review_notes",
    "metadata.user.source_device_id"
])
✅ Result:
Prevents
review_notesandsource_device_idfrom being indexedMakes it unsearchable via DQL or filters, do not count against the 100 searchable key limit, and are excluded from queries or filters
Keeps the metadata visible in the UI (dataset browser, item view, etc.)
Remove Keys (path) from Unsearchable Paths
If you decide that certain metadata keys should be searchable again, you can remove them from the list of unsearchable paths.
dataset = dl.datasets.get(dataset_id='datasetId')
success = dataset.schema.unsearchable_paths.remove(paths=['review_notes', 'source_device_id'])
This step uses the remove() method to delete review_notes and source_device_id from the list of unsearchable paths, allowing them to be searchable again. The method returns True if the paths are successfully removed.