Pipelines provide the capability to create automated models that seamlessly integrate human and machine elements for data processing within a structured pipeline framework. This architecture is composed of a series of interconnected nodes, where each node's output serves as the input for the next in line.
.png)
The Pipelines page allows you to manage and monitor your pipelines. Here, you can initiate new pipelines either from the ground up or by using a template, as well as access the dedicated details page for each individual pipeline.
Pipeline Process
DDOE's pipeline process enables the smooth transition of data across various stages, including:
Labeling tasks
Quality assurance tasks
Execution of functions embedded within the DDOE system
Integration of code snippets
Utilization of machine learning (ML) models
Throughout this process, your data can be filtered based on specific criteria, segmented, merged, and its status can be modified as needed.
In summary, DDOE's pipeline is equipped to:
Streamline any production pipeline
Preprocess and label data
Automate operations through applications and models
Post-process data and train models of any type or scale with the utmost performance and availability standards.
Process Example
In the following example, a pipeline is illustrated.
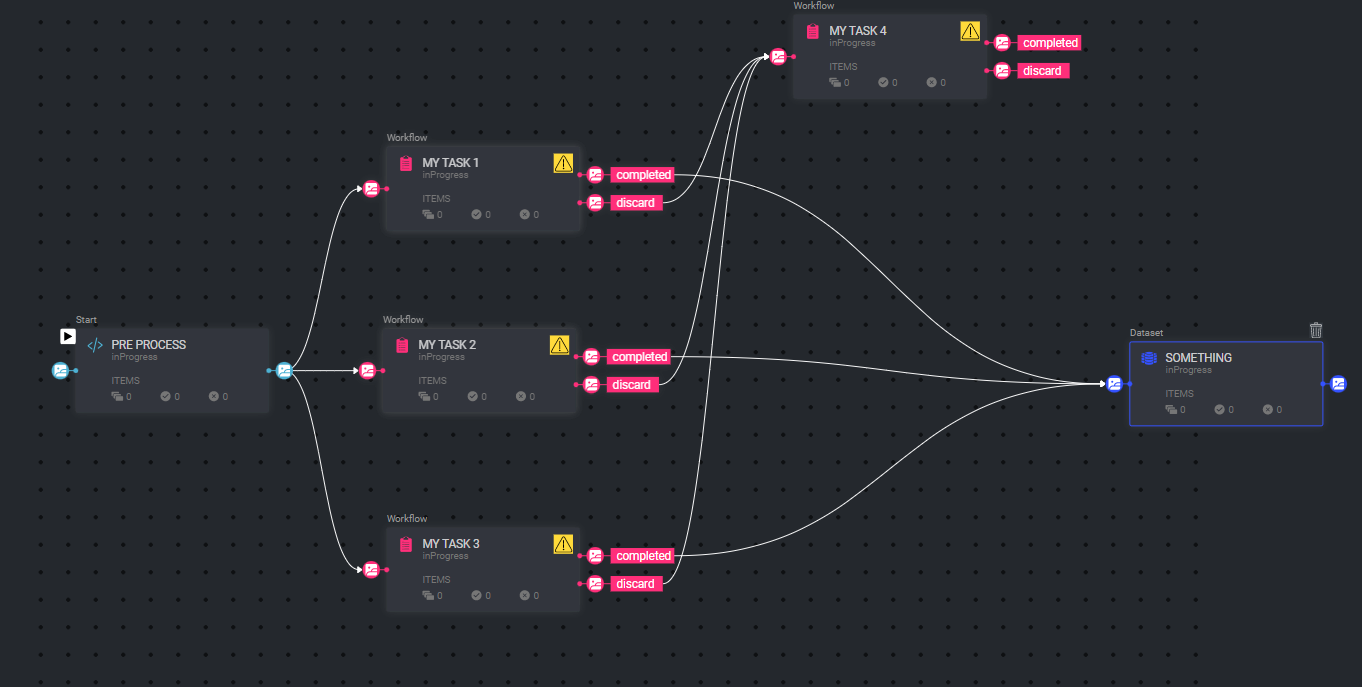
This pipeline involves the preprocessing of data by code, which may involve actions like segmenting a video into frames.
After the data is preprocessed, it is directed to three different tasks, all of which run in parallel.
Items that are marked as completed during these tasks are sent to a separate task, such as a Quality Assurance (QA) task.
Conversely, items that are labeled with a discard status are directed to a separate dataset for further handling.
Pipeline Nodes
DDOE pipelines provides a user-friendly interface for building, managing, and monitoring end-to-end machine learning workflows. DDOE's pipeline can be made up of different nodes, each with a different role in the pipeline, such as storing data, executing functions, training models, or sending data to annotation or QA tasks.
Pipeline Triggers
Triggers in DDOE's Pipeline system determine how and when data flows between nodes. They initiate execution in response to scheduled times, platform events, or manual actions, enabling dynamic and flexible data processing.
Active Learning Pipeline
The DDOE's Active Learning Pipeline (ALP) is a powerful and customizable feature designed to automate and streamline the iterative model training process on unstructured data.
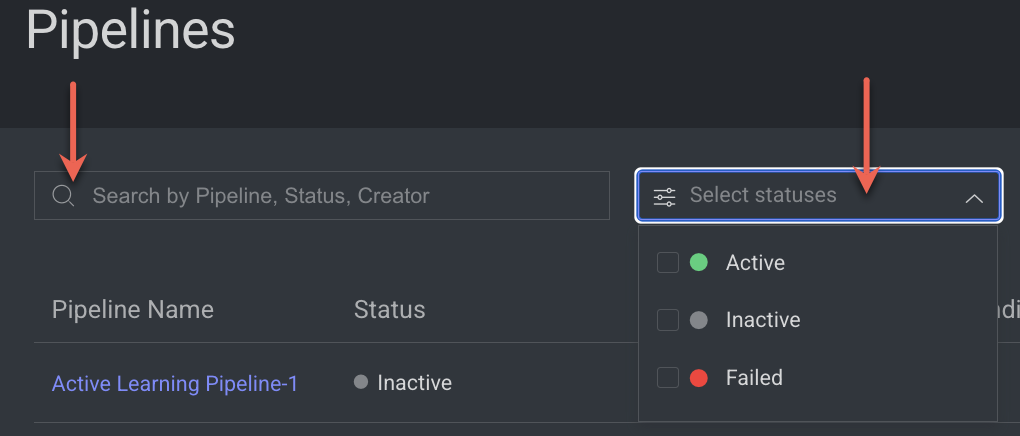
Search and Filter
The Pipeline page features a Search field, which permits you to employ the Pipeline's Name, Status, or Creator as search parameters for locating specific pipelines. Furthermore, you have the option to filter pipelines based on their status.
Pipeline Table
The Pipeline page displays a table containing a list of pipelines, with their respective details presented in individual columns. The available columns are as follows:
Column Name | Description |
|---|---|
Pipeline Name | The name of the Pipeline serves as the entry point to access the pipeline's canvas page. When you click on an Active Pipeline, it will open in View Mode, whereas clicking on a Paused Pipeline will open it in Edit Mode. |
Status | The status of the pipeline can be one of the following: Active, Inactive, or Failed. |
Pause/Play | Indicates whether the pipeline is currently active or inactive. By clicking on the play/pause icon, you can activate or deactivate the pipeline as needed. |
Pending Cycles | Indicates the number of pipeline cycles in the queue. Once the initial node service in the cycle becomes "active", the cycles will start running. |
Created By | The avatar displayed here belongs to the user who created the pipeline. |
Created At | This timestamp corresponds to when the pipeline was created. |
Updated At | This timestamp corresponds to when the pipeline was updated. |
Last Execution | This timestamp corresponds to the most recent cycle execution of the pipeline. |
Pipeline Actions
The Pipelines page enables you to perform various actions on pipelines:
Create Pipeline: Use the Create Pipeline button to create a new pipeline. For more information, see the Create Pipelines article.
Double-click on a Pipeline:
Double-clicking on an Active Pipeline will open the Pipeline in View mode.
Double-clicking on a Paused Pipeline will open the Pipeline in Edit mode.
Customize the table columns by clicking the Show/Hide Columns icon on the right-side.
Sort the table to present meaningful data by clicking the header of each column.
Clicking on the Ellipsis (three-dots) icon will provide you additional actions, including:
Copy Pipeline ID: This allows you to copy the Pipeline ID. It can be used for SDK Scripts.
Rename Pipeline: This allows you to rename the pipeline, with the caveat that renaming is not possible if the pipeline is currently running.
Manage Secrets: This enables you to handle available secrets for your pipeline. Clicking on Manage Pipeline allows you to add multiple secrets from the available list. Managing the pipeline's secrets allows you to create environment variables that will be securely stored in the vault. This is recommended when handling sensitive information, such as usernames and passwords, in your code.
View Executions: This feature allows you to view a detailed page of the pipeline executions based on the selected pipeline's ID.
View Logs: This option allows you to access a detailed page of the logs related to the selected pipeline's ID.
View Audit Logs: This feature provides access to a detailed page of the audit logs linked to the selected pipeline's ID.
Delete Pipeline: This action enables you to delete the selected pipeline.
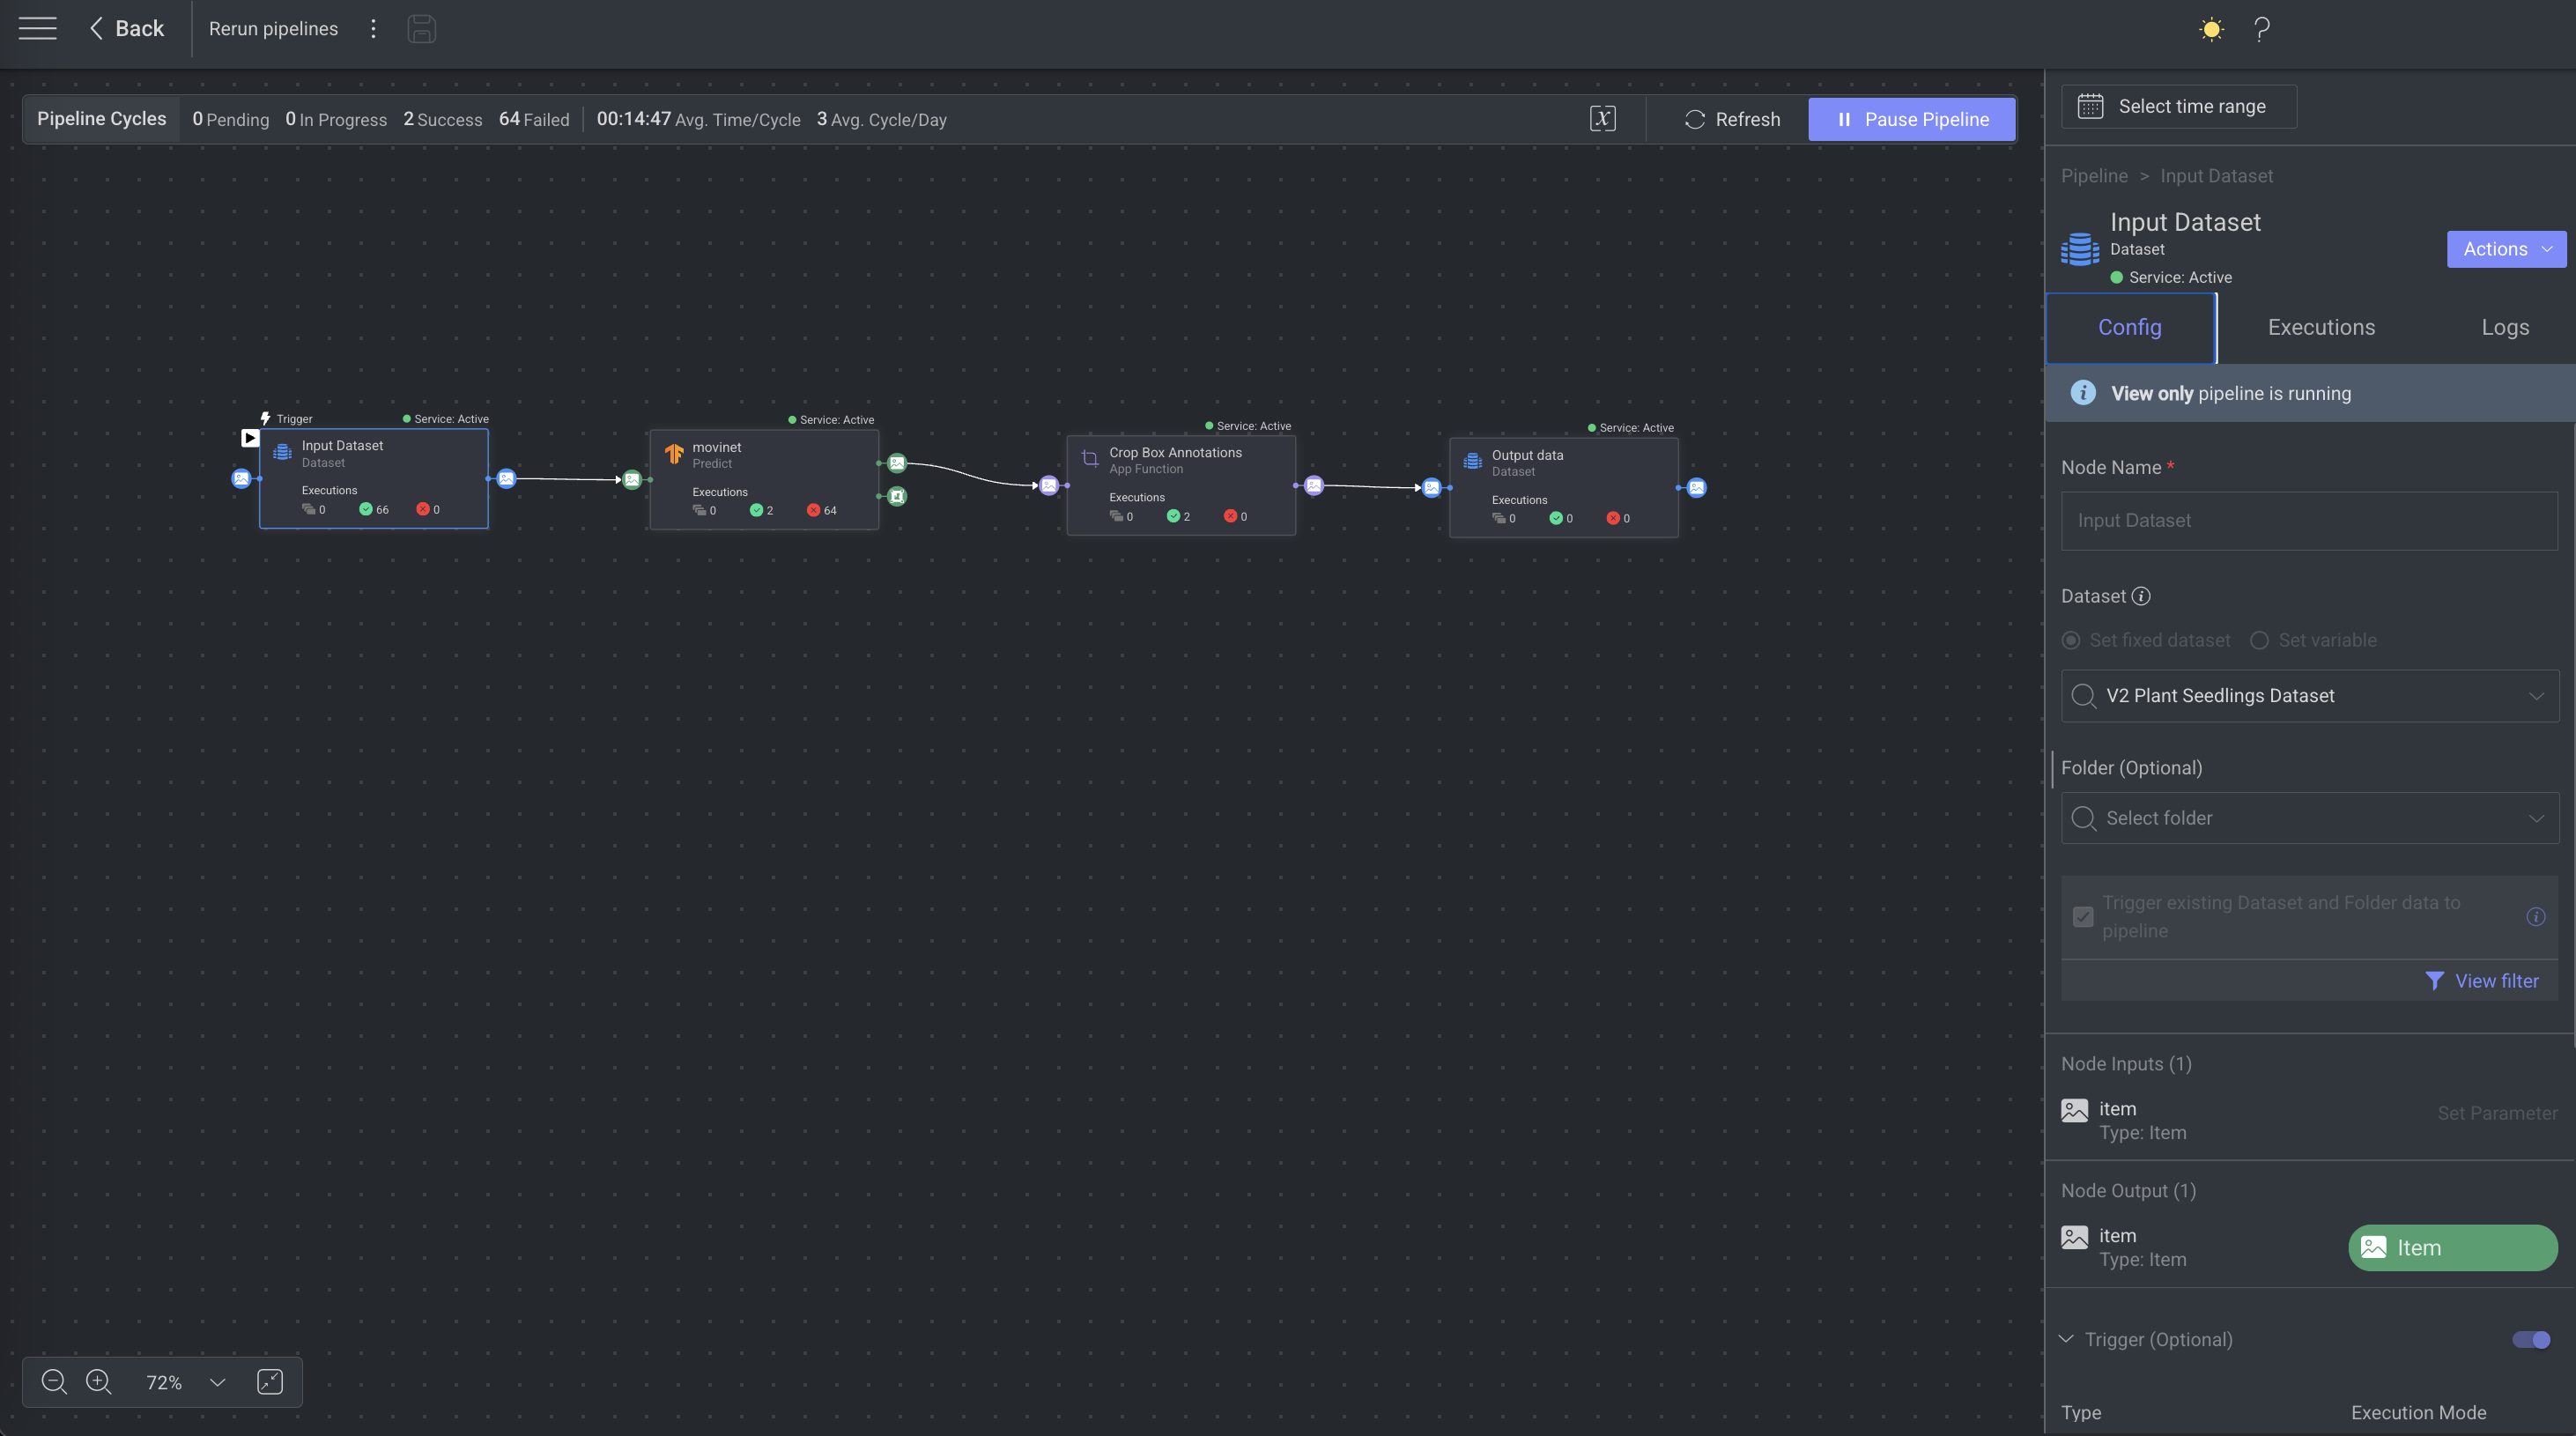
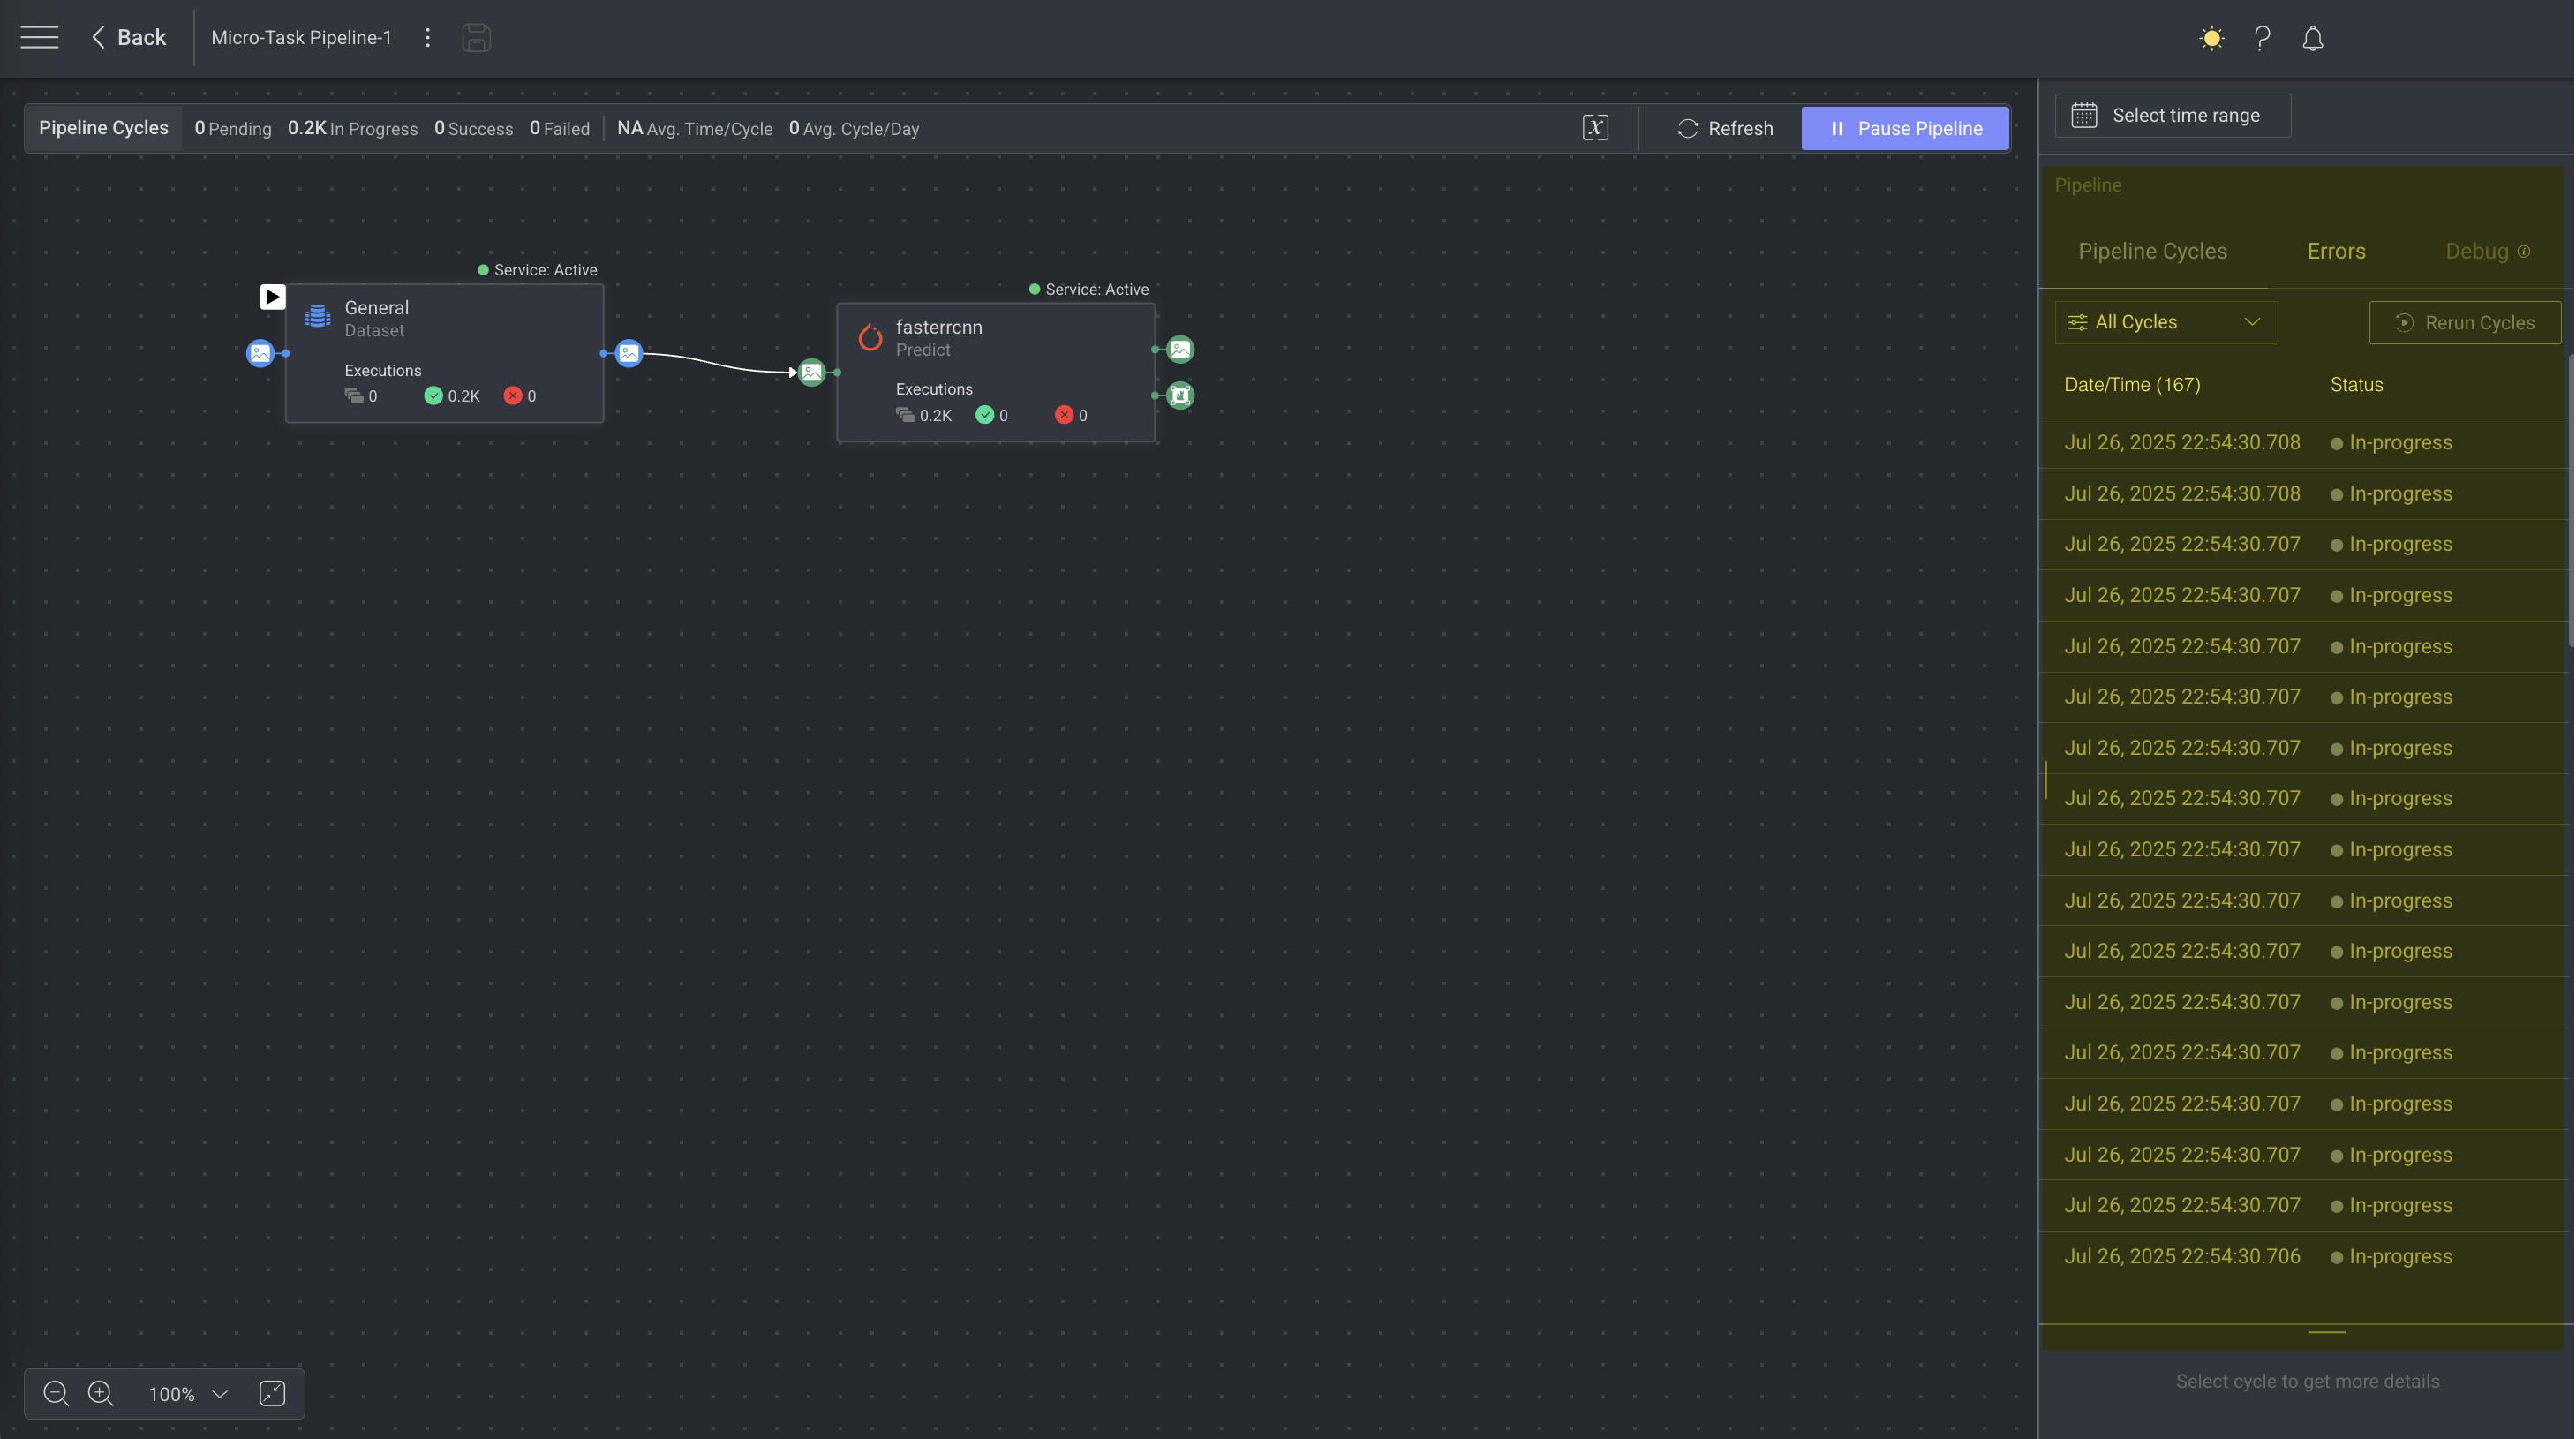
Pipeline Cycle Details
In the Pipeline page, you will find the Pipeline cycle details on the right-side panel. When no specific node is selected, the panel displays pipeline-level information.
The default setting in the Information Panel is to display information from the “Last 3 hours.” However, you may select a different time frame to display information from.
Manage Your Pipeline
DDOE allows you to filter data between nodes, add models and applications, configure triggers, manage secrets, reset pipelines, view executions and logs, update pipeline settings, and perform pipeline maintenance tasks such as renaming, copying IDs, or deleting pipelines.