Running and monitoring pipelines
- 11 Mar 2025
- Print
- DarkLight
- PDF
Running and monitoring pipelines
- Updated On 11 Mar 2025
- Print
- DarkLight
- PDF
Article summary
Did you find this summary helpful?
Thank you for your feedback
Start the pipeline
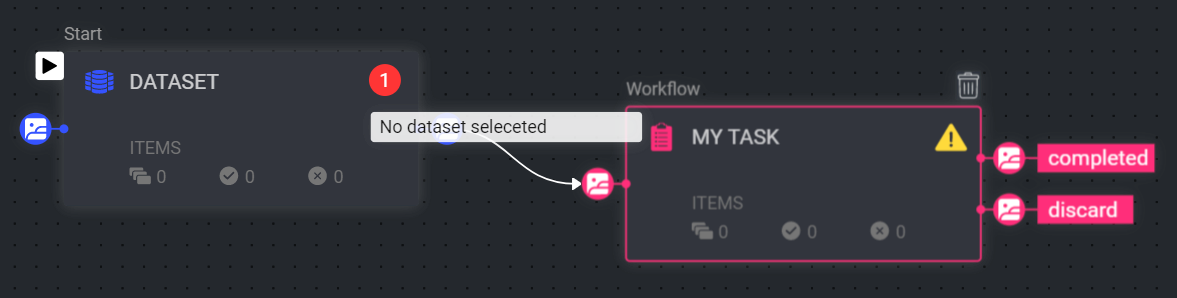
To install and activate your pipeline, click Start Pipeline in the pipeline editor screen or the play button from the project's Pipeline page. If you are unable to click Start Pipeline, or that the installation process has failed, it might be due to configuration issues of your pipeline nodes or errors in the pipeline composition:
- To monitor node configuration issues, hover over the warning/errors icons on the nodes to see what issues need to be resolved. Resolve the issue, and the warning/error icon should disappear.
- To monitor installation errors, click on the Error tab in the pipeline’s information panel on the right and check the error messages.

Invoking data to pipelines
Auto-Invocation: Cron & Event Triggers
Triggers can be defined in pipelines, to automatically invoke a pipeline flow based on events article in Dataloop system or on cron expression article.
To learn more about automatic triggers, click here.
Manual invocation: selected items in dataset browser
You can manually trigger data items from any dataset into any pipeline. You can trigger an entire dataset, a specific folder, all items from a DQL query/filter, or manually selected items:
- Open the dataset browser.
- Filter for specific items based on any criteria.
- Click the “Create Trigger” icon
 or right-click a folder and select “Create Trigger.”
 - Select the destination pipeline from the list and click “Approve.”
 or right-click a folder and select “Create Trigger.”
Manual invocation: using SDK filter
To add a trigger to any node in the pipeline, use the add_trigger() function, and then update the pipeline with the pipeline.update() function.
You can use the SDK to execute your pipeline flow from any starting point you wish. When creating the execution, you can specify the input for the pipeline execution you create (send a specific item Id, dataset Id, etc.) as well as using a DQL filter to specify several items, etc.
Pipeline Information Panel
In the Pipeline page, you will find the Pipeline Information Panel. When no specific node is selected, the panel displays pipeline-level information.
Scope – The default setting in the Information Panel is to display information from the “Last 3 hours.” However, you may select a different time frame to display information from.
Context – The sidebar has breadcrumbs at the top, displaying the current context (entire pipeline, specific node, or specific cycle), which also allows for easy navigation.

Pipeline Cycles
A Pipeline cycle refers to all node executions performed on a single pipeline run (usually over a specific item); the executions are listed in the order in which they occurred. Since some items may be routed differently in the pipeline based on filters and user actions, each cycle may have a different number of executions.
Select a cycle from the list to see its details, including first (node) execution time, last (node) execution time,
Select an execution from the list to see its details, including the function used in the execution, the input, and the output.
Clicking the play button will show the item's progress in the pipeline, highlighting the nodes involved in processing the item.

In the Pipeline Cycle list, click on the number in the Executions column to drill-in and see each execution. This allows you to browse the executions, see the highlighted node on the Pipeline canvas (which enables you to monitor the item’s progress in the pipeline), and see the execution details (input, output, item with item link, execution time, and duration).
Use the Up and Down arrows to browse between the executions and trace the item’s progress over the canvas.

Rerun Pipeline Cycles
Users can rerun pipeline cycles by selecting executions for rerun starting points or entire cycles for rerun to avoid regenerating the cycles again in the case of failure. Rerunning the cycle in the pipeline removes the item status from a task, so it will be reinserted into an assignment.

Node Details
Clicking on a node in the pipeline will bring up the Configuration tab relevant to that node. For more information about nodes and their configuration, see the Pipeline Nodes article.
- Executions tab: When a node is selected, the Executions tab provides details about the execution of each item processed through that node. Choose a specific execution from the list to access its detailed information. Dataloop stores executions for a maximum of 14 days.
- Logs tab: The Logs tab showcases all log entries, including function and service level logs, application installation processes (from initialization to completion), generated during executions of the corresponding node within the selected time-frame. Dataloop stores logs for a maximum of 14 days. Click on the log to view log details in the bottom. Utilize the following options to navigate through the logs:
- Search: Enter free text to search through the logs.
- Log Level Filter: Filter logs by selecting a level (critical, error, warning, info, debug) to find logs at that level and above.
- Show Service Logs: Show/hide service-level logs, aiding in the debugging and resolution of service-level errors and issues.
- Instances tab: This tab is active specifically for Custom nodes such as FaaS and Code nodes, providing information about the service instances (machine replicas) connected to the pipeline.
Node Status
The Node Service Status feature allows users to monitor the real-time status of their nodes, which is determined by the instance status. The available statuses include:
| Status | Description |
|---|---|
| Active | This status indicates that the FaaS service on this node is currently active. |
| Initializing | This status indicates that the FaaS service on this node is currently undergoing initialization. To check its status, select the node and open the Instances tab. |
| Inactive | This status indicates that the FaaS service on this pipeline node is paused, and pending executions will be queued. |
| Failed | This status indicates that the FaaS service on this pipeline node has encountered an issue preventing it from starting. Refer to the service logs to identify and address errors. |

- The service status for all services is shown in the pipeline once you activate it. Hovering over the Node Status triggers a popup, providing additional details about the status.
- The service status is visible only when the pipeline is in the running state and is not displayed when pausing the pipeline.
- The service status indication is shown in the following locations for the selected node:
- Top right-side of the Pipeline Nodes.
- Under the node name in the right-side panel.
- Instance tab in the right-side panel.
Errors to Scale Up a Service
Errors occurring in the service restart loop can impact Code/FaaS nodes, potentially hindering the scaling up of the node service (FaaS). The possible causes can be issues with defined requirements or the specified Docker image. When such errors occur, an indicator will be displayed on the corresponding Pipeline node, along with details about the affected service in the installed FaaS table on the Application Hub page.
- Pipeline service error indication: The error message below appears on the pipeline nodes page during the execution of a pipeline if its associated service has failed.

- FaaS page service error indication: The error message below appears on the FaaS page if the service has failed.

- Pipeline node error when executing a pipeline with an inactive service: The below error message appears during the execution of a pipeline if its associated service is inactive.

Overcoming execution errors
After resolving the root cause for any problem that resulted in failing to execute items (e.g. code problems in packages, insufficient compute resources), you can rerun the execution of failed items
- From the side-panel – select the node, switch to the Executions tab, select the Failed filter option, hover over an item and, click the Rerun button.
- From the Applications (FaaS) > Executions page – in the search field, filter by pipeline and by execution.status: failed, and select Rerun All.

Pausing a pipeline with running cycles
Once pausing a pipeline with any pending/running cycles, the cycles' status will be updated to "Paused" and the cycles will stop running. When resuming the pipeline, a dialog will open offering two options:
Resume all available cycles (pending/in-progress)
Abort all available cycles (pending/in-progress) - cycles will get "Terminate" status
Aborted CyclesAt the moment, aborted cycles are filtered out automatically from the cycles list in the side panel (can be displayed by filtering cycles with "Terminated" status) and are excluded from the pipeline "statistics bar" counters as well.
If the pipeline was modified while paused and you choose to resume it, the resumed cycles will continue to run according to the new pipeline composition.
Pause Action Limitations
The "pause" action may not immediately halt all pipeline activity.
Node executions that have already started running will not be affected, and will only be paused once the current execution is completed. Additionally, it is possible that cycles that are waiting in a node queue at the pause time will be still executed on the node, before being paused.
Pausing a pipeline with active event triggers
You are provided with the option to keep the pipeline event triggers active when the pipeline is paused, so you won't loose events while editing the pipeline. Please click here to read more.