Overview
VS Code is a DDOE-integrated application that offers a robust and unified environment for debugging application services.
With a built-in code editor, it enables you to view, edit, and debug code files directly within the same ecosystem where your applications are developed and deployed.
By leveraging this powerful tool, you can:
Efficiently identify and resolve issues within your services.
Seamlessly update the application codebase (package) without leaving the DDOE environment.
Prerequisites
Before accessing VS Code for your application service, ensure the following requirements are met:
1. Install Your Application
Ensure that your application is properly installed and an associated application service has been created.
You can view and manage your services under CloudOps > Services.
2. Activate the Service
VS Code can only connect to active services.
Verify that the target service is in an active state before attempting to initiate a VS Code session.
3. Use SDK Version 1.73.0 or Higher
VS Code requires services to run SDK version 1.73.0 or above for compatibility.
To check or update the SDK version:
Navigate to Service Actions > Edit Service Settings > Advanced.
4. Use Python 3.8 or Higher in Custom Docker Images
If you're using a custom Docker image, it must be based on Python 3.8 or higher.
DDOE Docker Image
The default DDOE Docker image already includes the correct Python version.
Considerations
You can navigate to other pages on the platform to easily debug your service while VS Code is open.
The VS Code editor for GPU-type machines is currently Beta version only.
Multiple services cannot be connected to VS Code within the same browser tab. To work with VS Code simultaneously on another service, open a new browser tab.
services cannot be paused while connected to VS Code.
Compute
Instance Allocation
Initiating a VS Code session, a new instance is allocated to the service. Any other running instances (if there are any) will be temporarily shut down and will resume once the session is terminated.Scaling Down Resources
Reducing allocated resources to a single instance can cause resource shortages during high loads. Executions might be queued until the session is terminated, potentially causing delays.
To learn more about executions processing during VS Code session, click here.
Resource Consumption
While VS Code session is active, it will allocate computing resources to the service, using computing hours. Make sure to terminate the session once you're done to avoid unnecessary consumption of resources.
The project will consume compute hours when VS Code session is on.
Starting a Session
To activate VS Code for one of your activated application services, follow these steps:
1. Navigate to the Services Tab
In the DDOE main navigation menu, go to CloudOps > Services.
The Services tab lists all available services, including both Model Services and Pipeline Services (created via Code or Custom nodes).
Finding Specific Services:
Model Services: Use the Search by Context field in CloudOps > Services to filter based on
model.idormodel.name.Pipeline Services: You can also access pipeline-related services directly from the pipeline interface:
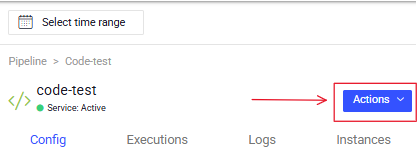
Open the Pipeline.
Click on the relevant Node.
In the right-side panel, select Actions > Open Service Page.
This will redirect you to the service’s page in CloudOps, where you can use Service Actions > Open VS Code.
2. Open the VS Code Interface
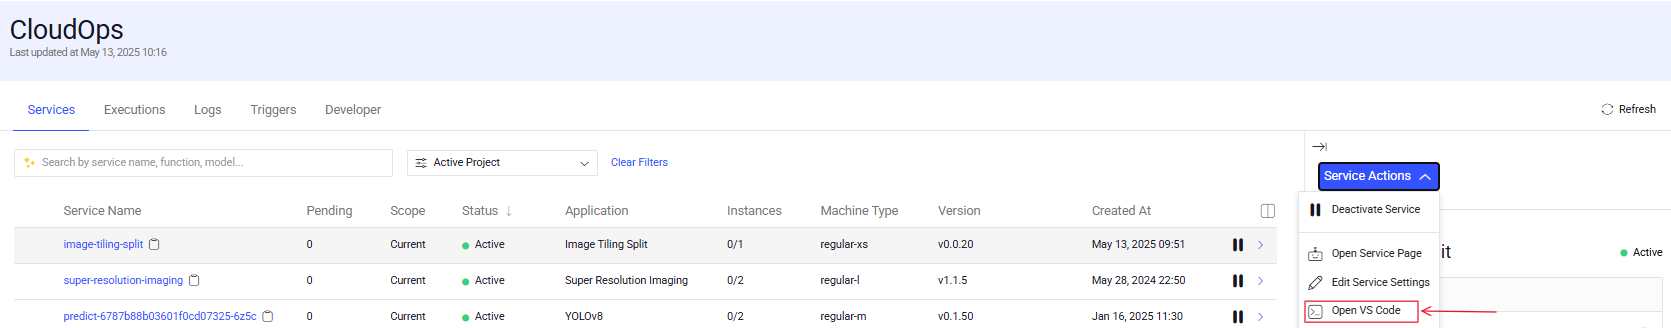
Locate the relevant service in the Services tab.
Open the Services Actions menu associated with the service.
Select Open VS Code to launch the integrated development environment. Ensure all VS Code prerequisites are met before proceeding.
3. Confirm the Service Scale Up message
Confirm the Service Scale Up message, that results in scaling up the service instances. For more information, read here.
VS Code will open inside a new frame at the bottom of the DDOE platform. It can take a few minutes for the session to be initialized while DDOE sets the environment according to the Docker image set for the service or any dependencies specified via a requirements file.
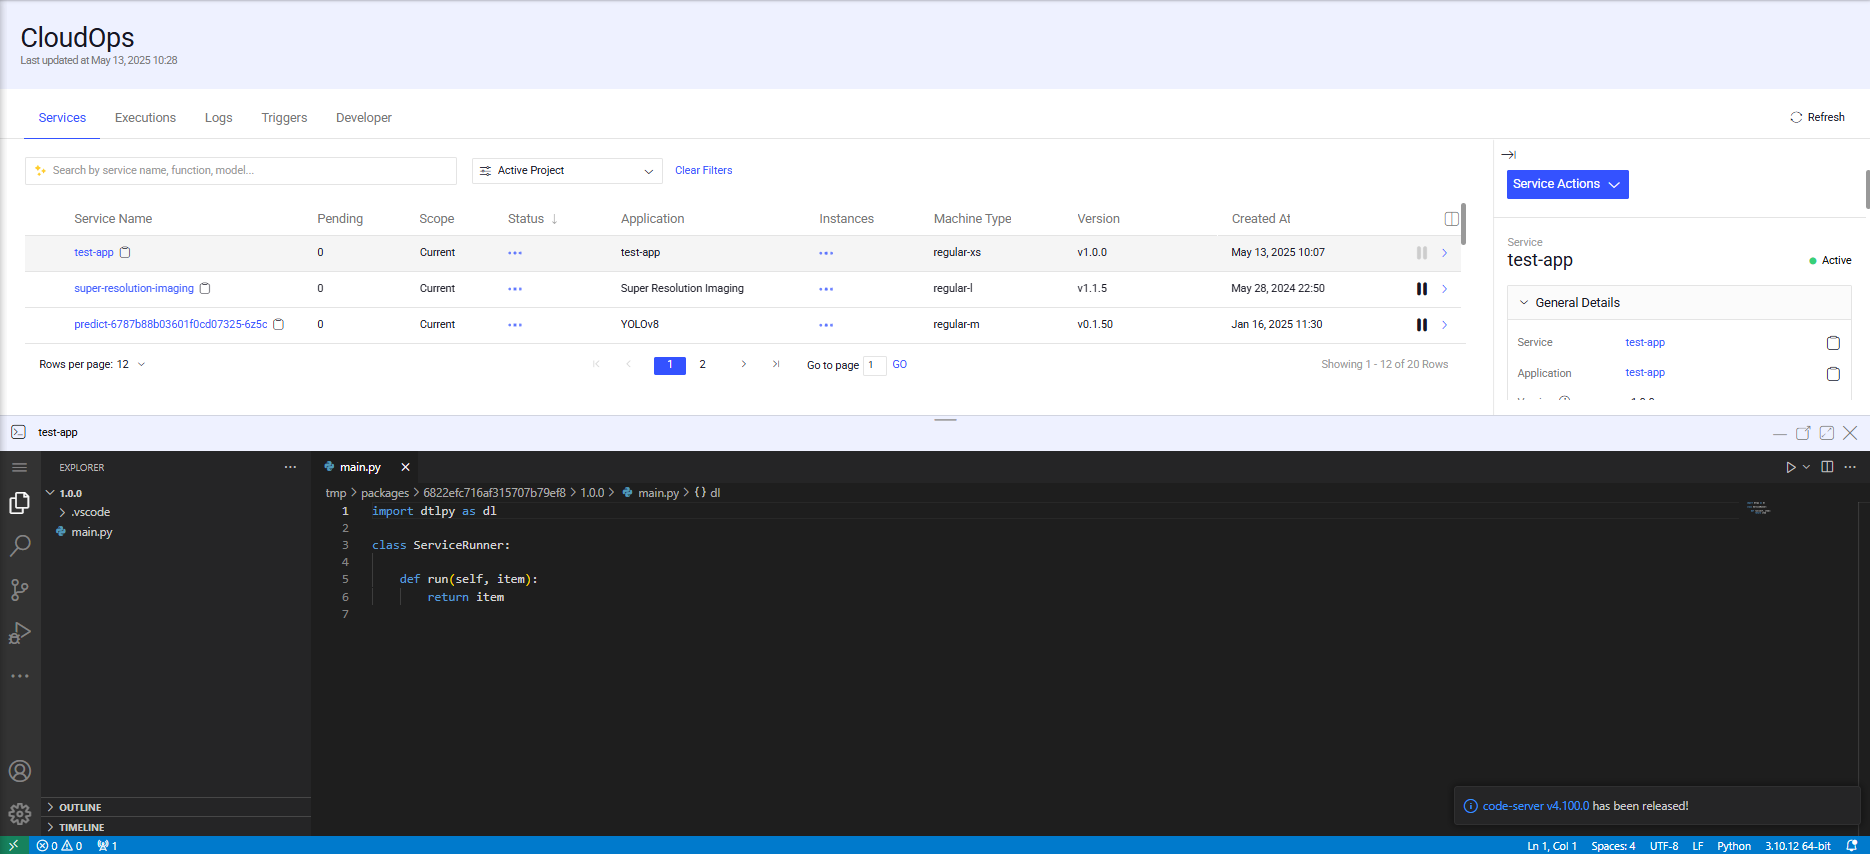
Activity Sidebar
Explorer: Browse the files of your application (package).

Search: Search your files for a string or regular expression.

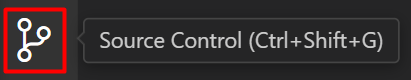
Source Control: Manage application files with VS Code's Git support.

Run & Debug: Debug your application by setting breakpoints and inspecting variables.

Adjusting Display Window
Use the top bar buttons to maximize or minimize the pane.
![]()
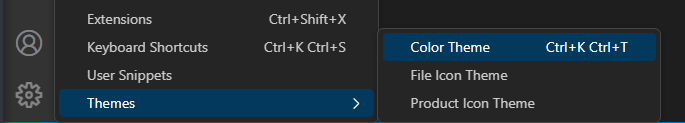
To switch between themes, follow these steps:
Click Settings.
Choose Themes > Color Theme. A dialog box will open, allowing you to switch between Light or Dark themes or any other available options.
For more information about the user interface, see the User Interface article.
Debugging
The VS Code editor allows you to easily debug your application service by setting up breakpoints, inspecting variables, and stepping through the code, all against a live DDOE instance.
If you have multiple files available in your codebase, click the "Source Control" button on the activity bar of VS Code and then select the file from which you wish to start debugging.
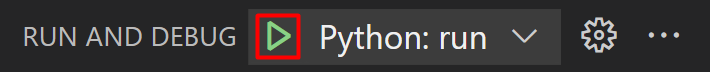
To bring up the Debug view, select the "Run and Debug" button in the sidebar.

Set breakpoints or add custom debug configuration before starting the debug session.
In the Debug View, initiate a debugging session by clicking the "Start Debugging" button. If you wish to use a custom configuration, select it from the dropdown list first.
After the debug session starts, you can manage it with the Debugging action:
Pause, Step Over, Step In, Step Out, Restart, and Stop. For more details, refer to this article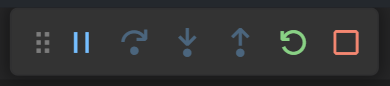
Create Executions
When VS Code is connected to a service, new executions (created by event/cron/manual triggers) or executions that didn't start running yet will be queued until initiating the VS Code debugger or terminating the VS Code session.
Once the debugger is running, the executions will be processed according to the debugger settings (any breakpoints or configuration).
Our Recommendation:
Trigger your functions while the debugger is active to test and debug your code with real time executions.
Easily trigger the function by rerunning an existing execution. This is especially useful for debugging failed executions.
This approach applies to both Pipeline and Model executions.
To rerun an execution > Go to CloudOps > open the executions tab > locate the relevant execution by filtering based on the service, pipeline, model, or application name
Visual Studio Code IDE
As DDOE's VS Code application is based on Visual Studio Code, explore this article to master the VS Code debugger.
Updating a Package
The service codebase, which is the package, can be updated directly from the VS Code editor or console. Once you update the codebase files, you can push the updates to modify the package, and a new version will be created.
To start using the updated package for your version, updating the service is required.
Service Update During the VS Code Session
Updating a service is not allowed when VS Code is activated. To update the service with any changes, terminate the VS Code session first (click X).
Updating a Service
As mentioned above, updating a service that is connected to the VS Code is not allowed for any reason (update compute settings, package version, etc.).
To update the service, first terminate the VS Code session (click X). Updating the service version can be done via the SDK (locally) or from the DDOE interface:
Select CloudOps > Services tab.
Select the service from the list.
In the General Details section on the right-side panel of your service, click on the Update button next to the version.
Terminating a Session
Click on the X icon in the top-right corner of the opened VS Code window. There is no option to save your updates.
The following dialog will open, click Yes, Terminate to approve session termination.

After the session concludes, the resources allocated to VS Code will adapt in accordance with the service configuration, including features such as autoscaling and minimum replica settings. Any pending tasks or executions in the queue will automatically resume and begin running as soon as a running instance becomes available.