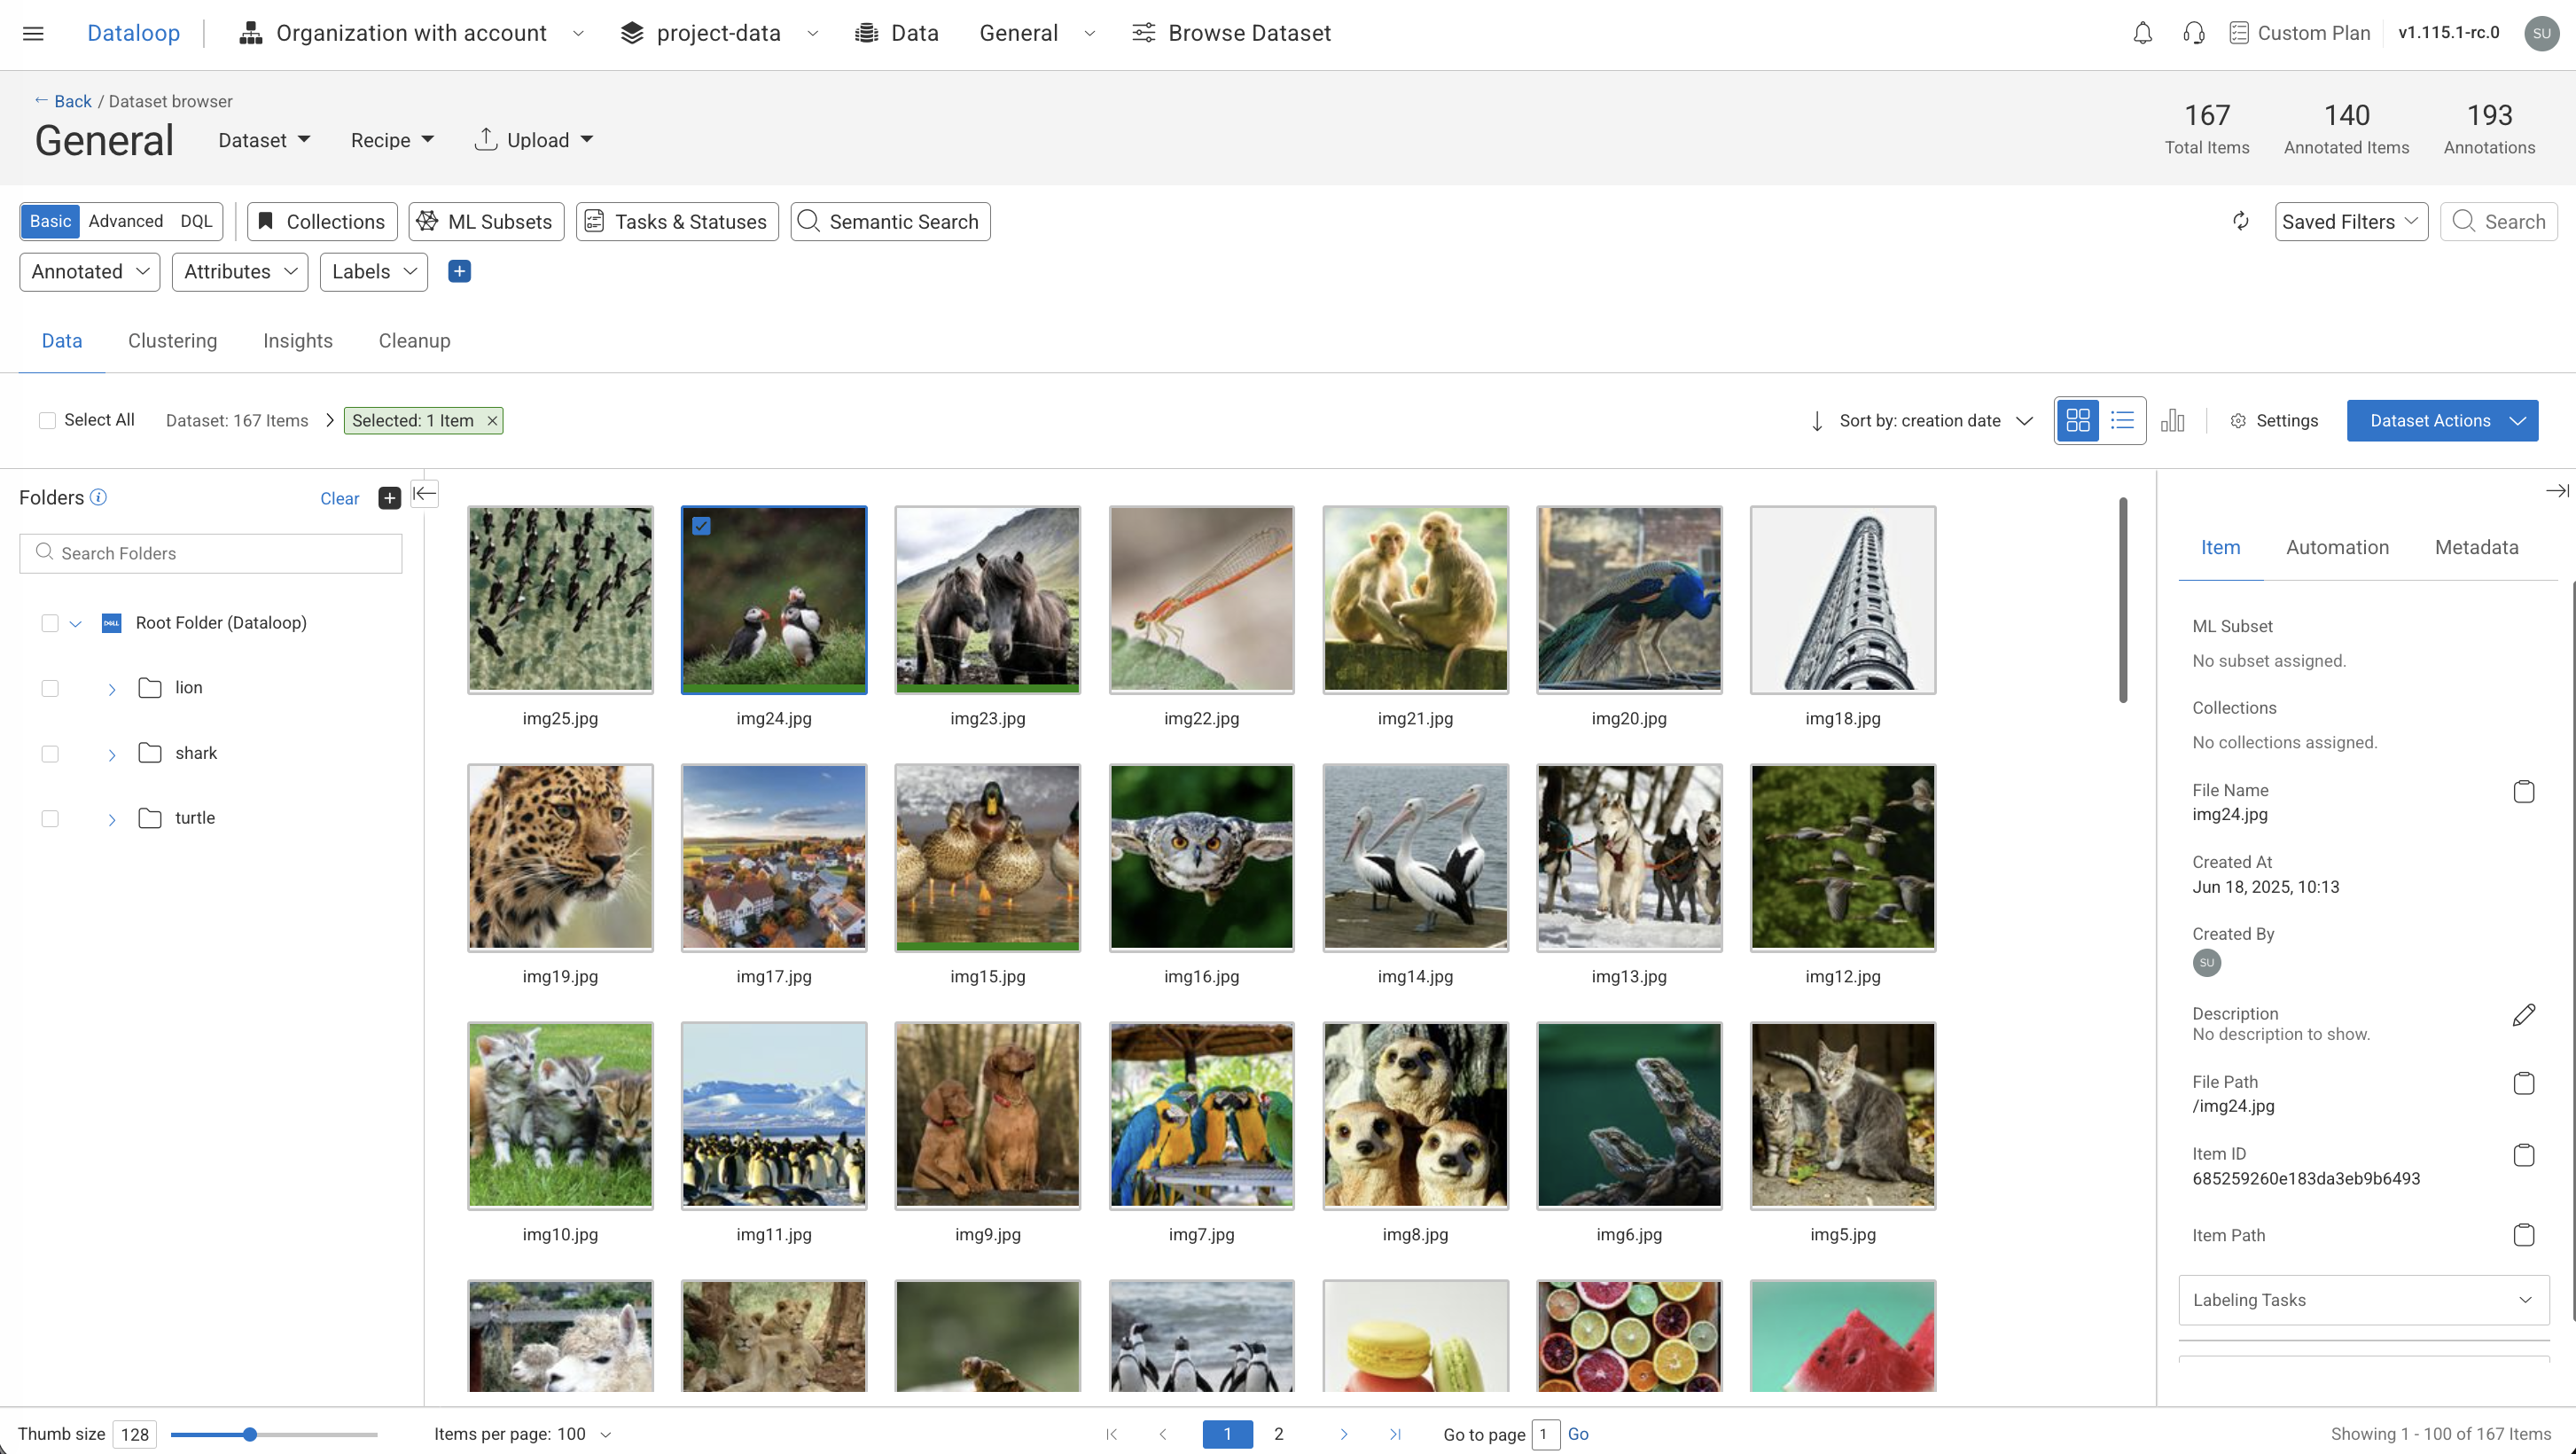
The Dataset Browser provides an intuitive interface for exploring, managing, and interacting with dataset items. It enables users to efficiently navigate and analyze data at scale through the following capabilities:
Search & Navigation: Provides basic search, advanced filtering, and support for DQL queries. Enables efficient filtering, sorting, and browsing across multiple data types, including images, text, audio, video, LiDAR, and more. Collections, ML Subsets, Tasks and Statuses, and Semantic search
Dataset & Recipe Management: Allows users to upload individual files or entire folders directly into datasets.
Storage: Dataloop enables seamless synchronization with your cloud storage. When a dataset is connected to a storage driver, a Storage button appears in the interface, providing visibility into the synchronization status and allowing you to upload files or folders directly into the dataset.
Data Visualization & Insights: Uses clustering techniques to visualize data distributions and identify patterns. Enables insight generation and dataset cleanup, such as removing duplicates or irrelevant items.
Item-Level Actions: Allows selected items to be added to labeling tasks, used in prediction workflows, or processed through integrated applications for downstream operations.
Access the Dataset Browser
Access the dataset browser using one of the following options:
In the Dataloop left-side menu, select Data.
For existing datasets, double-click on the name datasets to open the dataset browser.
For a new dataset, see the Create a dataset article.
In the Dashboard > Data Management widget, click on your Dataset name.
Your access is based on your Role and Permissions.
Dataset in Read-Only Mode
During export, the dataset enters Read-Only Mode to prevent changes. A warning message will appear in the data browser if the opened item belongs to a dataset currently being exported. While locked:
Saving and modifications are disabled.
Auto-save is off to avoid errors.
Save and Status buttons are disabled.
Actions will trigger an error message.
🔄 Use the Refresh button to check the latest status. Developer or Project Owner can click Unlock to unlock the dataset if needed. Read more
Dataset Details
The Dataset dropdown menu in the Dataset Browser provides key information and management options for the currently selected dataset.
From this menu, you can:
View user information: Displays the email ID and timestamp of the user who created the dataset.
View embeddings: Opens details of the embeddings available in the dataset. Learn more.
Related-Tasks Analytics: Redirects to the Progress tab of the Analytics page, where you can collect, analyze, and derive insights from the dataset. Learn more
Copy Dataset ID: Shows the unique dataset ID. Use the Copy icon to copy it.
Export the dataset: Opens a popup where you can configure and export the dataset in JSON format. (Learn more). Learn more
Clone the dataset: Create a duplicate of the dataset.
Delete All Annotations in the dataset.
Delete the Dataset
Embeddings
The Embeddings section on the right panel after clicking on Datasets → View Embeddings provides crucial information about the feature vectors associated with the dataset. Here's a detailed breakdown:
Feature set: The label indicates that the feature set name. For example, clip, nnlm, text-embeddings, etc.
Feature vectors: The value refers to the number of feature vectors generated, corresponding to the number of items in the dataset.
Status: The status (for example, Success) signifies that the embedding process has been completed successfully, meaning all the items have been processed to generate their respective feature vectors without any issues. Available Statuses are Success, Running, Created, and Failed.
Updated At: This field shows the date that the embeddings were last updated. It indicates the most recent time the feature vectors were recalculated or updated based on changes in the dataset.
Model Application Name: If available, it displays the name of the model used to extract the feature vectors.
Add Embeddings
Click Add to select a model to extract embeddings for the selected items. It displays the Extract Embeddings side-panel, where it allows you to select the deployed model to start the extraction process by clicking on the Embed.
Also, select the checkbox to enable the Automatically run on new dataset items feature.
If you have extracted embeddings using a model, the following actions are available when you click the three dots:
Open Model: Click this option to open the Model's details page.
Run on New Items: Click this option to initiate the extraction process for new items added to the dataset.
View Logs: Click this option to open the Service Logs page.
View Executions: Click this option to open the Service Execution page.
Select Model: If the Dataset has no embeddings, click Select Model to browse the project model registry to choose an embedding model. It displays the Extract Embeddings side-panel, where it allows you to select the deployed model to start the Extraction Process by clicking on the Embed.
Recipe Details
The Recipe dropdown menu in the Dataset Browser provides key information and management actions for the selected recipe.
Available options include:
Recipe Details – Displays the recipe name along with its creation and last updated dates.
Quick Preview – Opens a preview of the recipe for quick reference.
Open Recipe – Opens the recipe in a new browser tab.
Copy ID – Copies the recipe ID to the clipboard and confirms the successful copy.
Export Ontology – Exports the recipe’s ontology in a JSON format.
Replace Recipe – Allows you to replace the current recipe with another one. When selected, a popup appears where you can select a new recipe from the list to apply.
Upload Items and Folders
Dataloop enables seamless dataset management by allowing you to upload data directly into its file system or sync from external cloud storage solutions. This flexibility ensures efficient data organization and easy accessibility within the platform.
Learn more about upload.
Storage Driver Details
When a dataset is connected to a storage driver, a Storage button becomes available in the interface. This menu provides access to storage synchronization settings and upload options, enabling seamless integration between external storage and your dataset.
Available Options include:
Sync Details – View information about the current synchronization status between the dataset and the connected storage driver.
Sync Now – Manually trigger synchronization to ensure the dataset is up to date with the latest changes in the storage.
Upload Files / Folders – Upload individual files or entire folders directly to the dataset.
Items Details
Choose an item to view the following details in the right-side panel:
ML Subset: Displays the ML Subset tab if the item has been assigned to a subset, such as
Validation,Test, orTrain.Collections: Displays the collection folder name of the selected item.
File Name: The name of the selected item. Click on the copy icon to copy the file name.
Created at: The creation date of the selected item.
Description: The text description of the item. Click on the pencil icon to add or edit descriptions. Also, item descriptions can be added during file uploads, serving as an additional way to search for items containing specific text or descriptions.
File path: The folder path where the file is located. Click on the copy icon to copy the file path.
Item ID: Unique identification for the item. Click on the copy icon to copy the item ID.
Item path: A URL link to the item on the Dataloop platform. Click on the copy icon to copy the item path.
Parent Item Link: If the item is a clone, it shows the parent item as a link. The link takes to the datasets where the original item is located, filtered to that item.
Labeling Tasks: This section provides the number of annotations and classifications associated with the selected item.
Automation
The Automation tab allows your selected item to run with an Application, Pipeline, or Model Predictions. Click on the following options to create a function, pipeline, or model prediction execution:
Run with FaaS: It lists the functions of the all the activated Application services. Select a function to execute with the selected items.
Run with Pipeline: It allows you to select a pipeline to execute with the selected items.
Run Model Predictions: It allows you to select a model to generate predictions for the selected items. Only trained and deployed models are available for selection.
When executions are available, you can search executions by function, application, or pipeline. Also, the following details are displayed:
Pipeline: The name and link of the pipeline. Click on the link to view the pipeline.
Application name: Name of the application.
Function name: Name of the function.
Execution Status: Success, Running, Created, and Failed.
Updated At: Date and time of the execution update.
Rerun: If needed, click the Play icon to rerun the execution.
Filter icon: Filter executions based on the status, such as Success, Failed, Running, and Pending.
Logs and Executions
Click the link to access a comprehensive overview on the Executions or Logs page.
Metadata
Item metadata refers to the descriptive information and attributes associated with individual items within a dataset.
You can perform the following actions:
Click on the copy icon to copy the metadata.
To edit the metadata:
Click the Edit icon to open the editor.
Make changes as required.
Click on the Save icon to save the changes.
Show Hidden Files
In the Dataset Browser, click on the Settings icon.
Enable the Show Hidden Files option.
The hidden files will have the hidden icon (crossed eye) in the corner of the hidden item/folders. Also, the thumbnail will be grayed out.