DDOE’s Pipeline Debugging and Monitoring page provides a streamlined way to track and troubleshoot pipeline executions. It enables you to inspect individual pipeline cycles and node executions, rerun failed tasks, and resolve errors efficiently. With these capabilities, you gain full control over pipeline performance—ensuring smooth, reliable, and optimized data workflows.
Pipeline Cycles
A pipeline cycle represents the full sequence of node executions during a single pipeline run, typically tied to a specific item. Each cycle records the nodes in the exact order they were processed. A pipeline cycle represents the complete sequence of node executions that occur during a single run of the pipeline, typically for a specific item. Each cycle logs the executed nodes in the exact order in which they were processed.
Because items may take different paths through the pipeline—depending on filter conditions or user-defined routing—each pipeline cycle may vary in the number and type of node executions included.
Cycle Status
You can filter the list of pipeline cycles based on their status. Available status are:

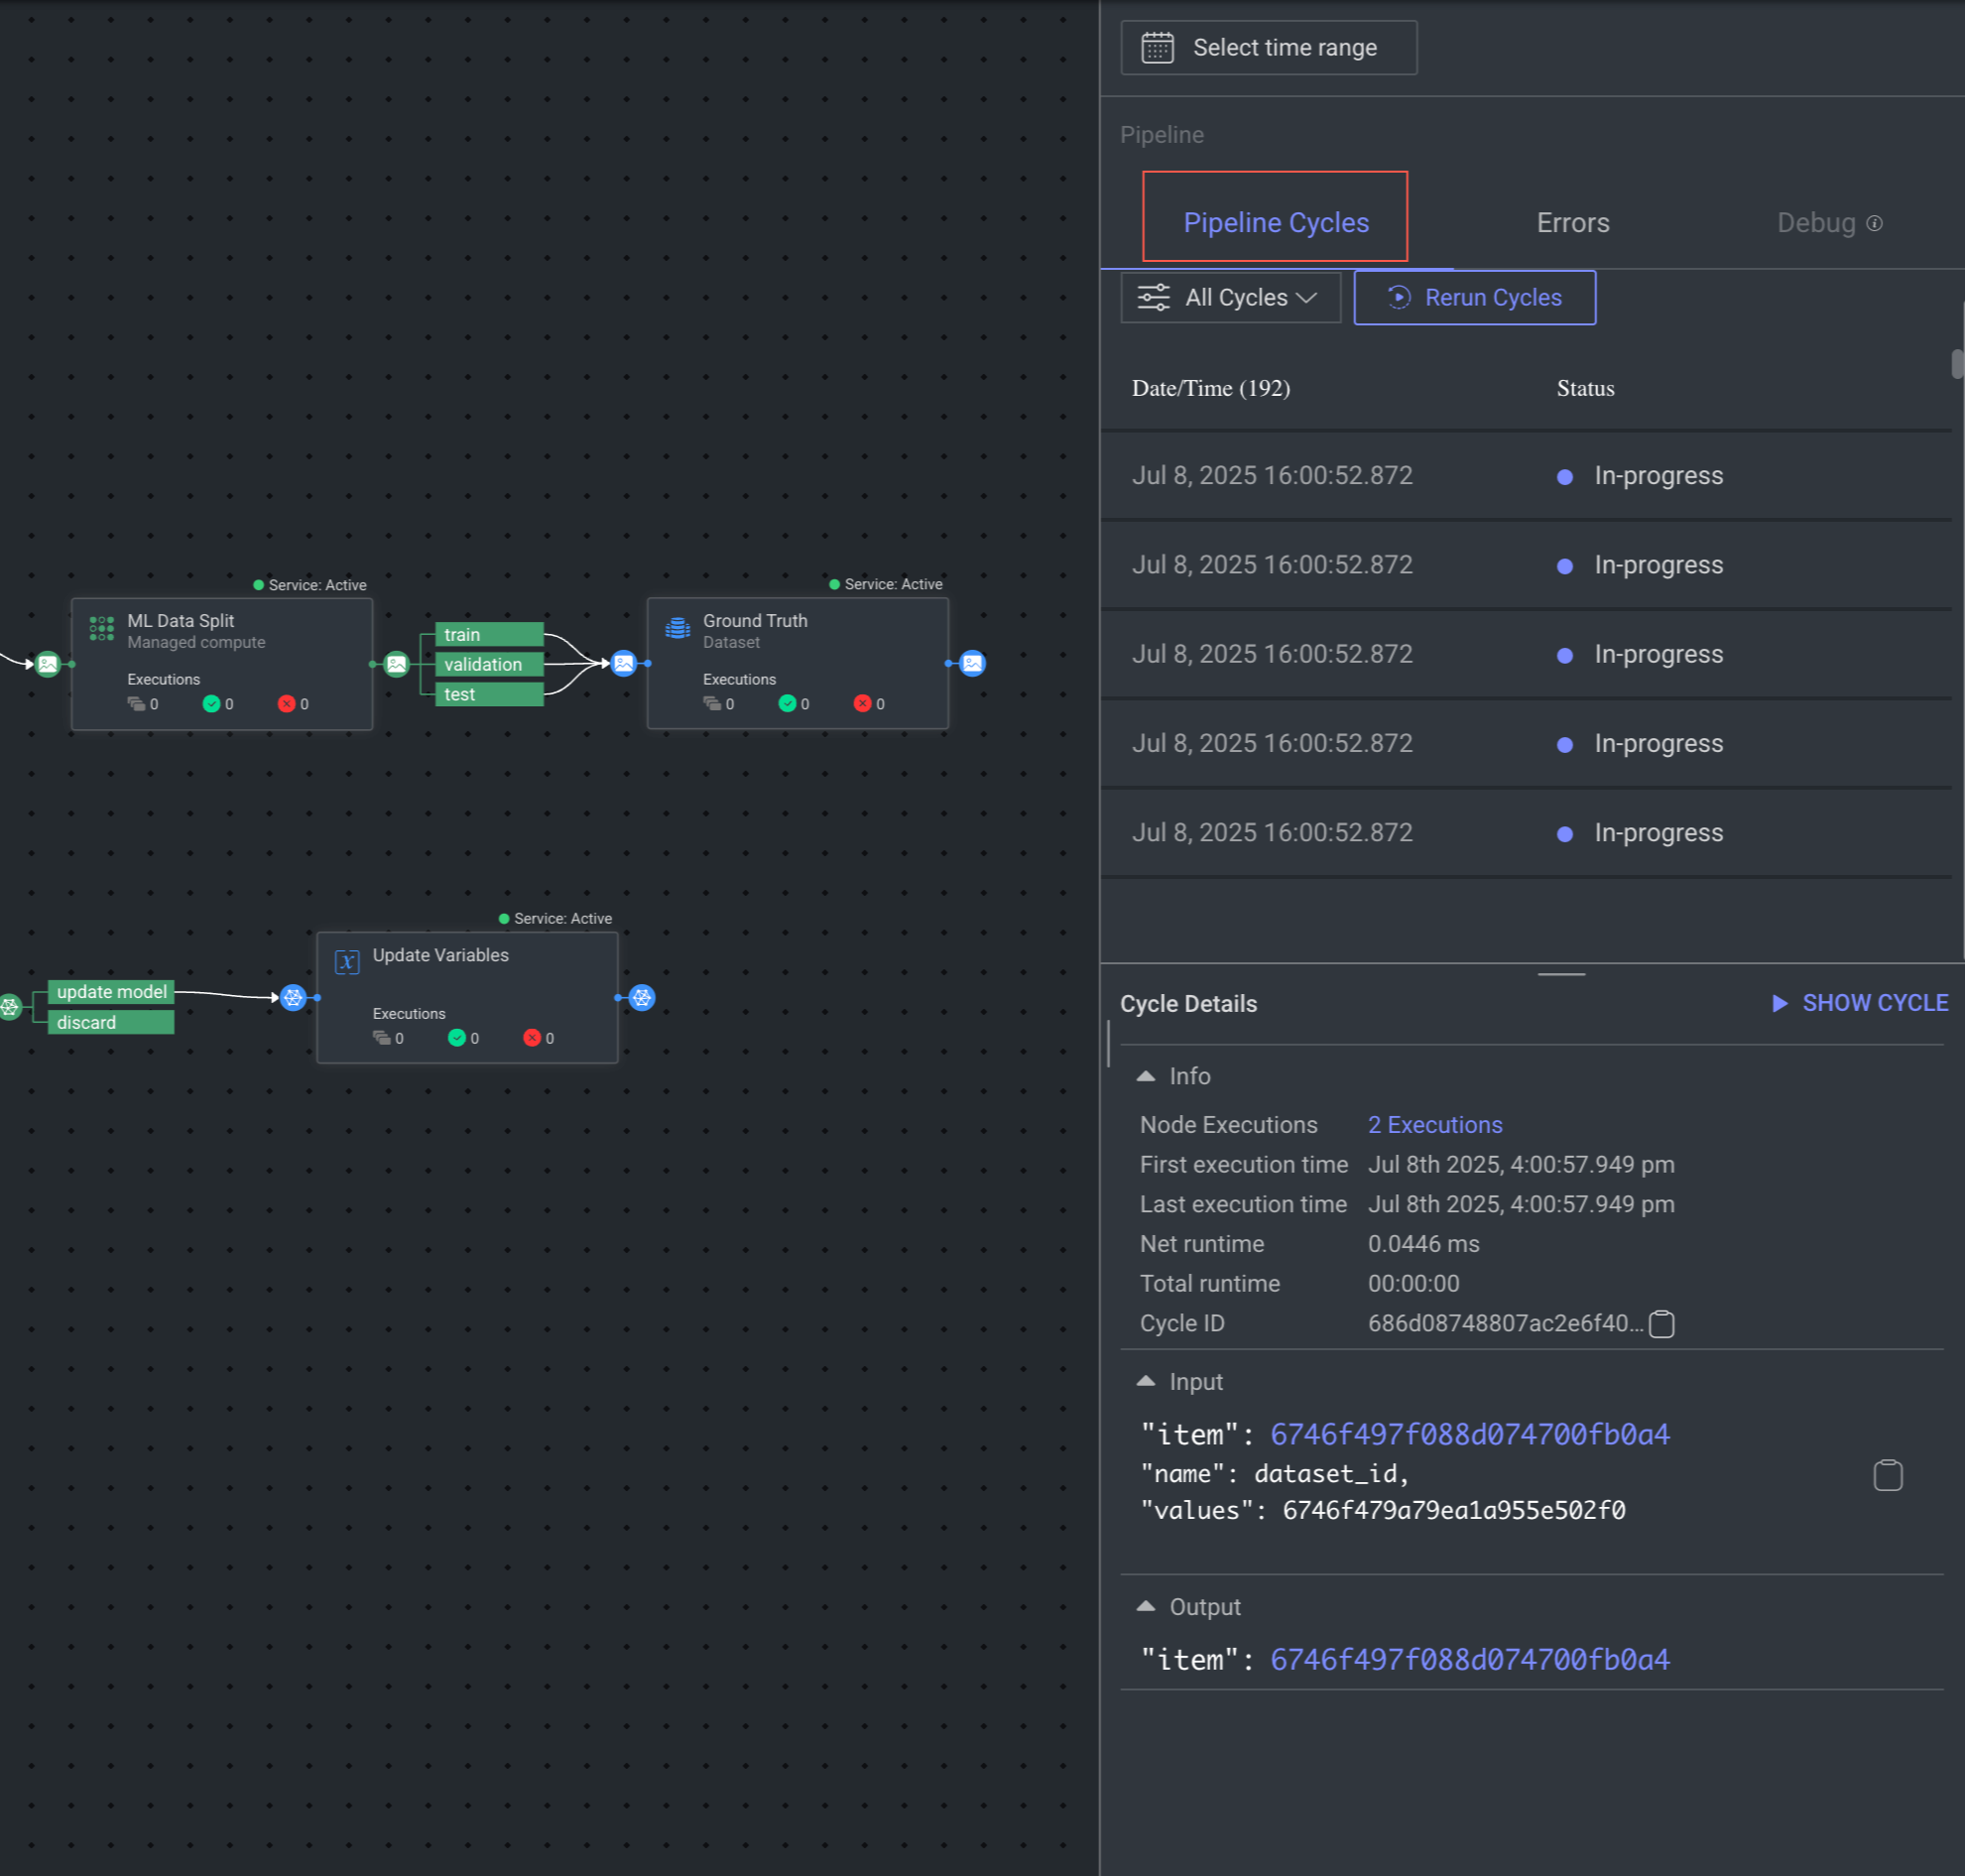
Select a cycle from the list to see its details, including number of executions, first (node) execution time, last (node) execution time, , etc.

Clicking the play button will show the item's progress in the pipeline, highlighting the nodes involved in processing the item.
.gif)
Rerun Pipeline Cycles
Users can rerun pipeline cycles by selecting executions for rerun starting points or entire cycles for rerun to avoid regenerating the cycles again in the case of failure. Rerunning the cycle in the pipeline removes the item status from a task, so it will be reinserted into an assignment.
Select the Pipelines from the left-side menu.
Open the pipeline from the list.
Click outside the pipeline (clicking on a node does not display the Pipeline Cycles.)
Click Rerun Cycles.
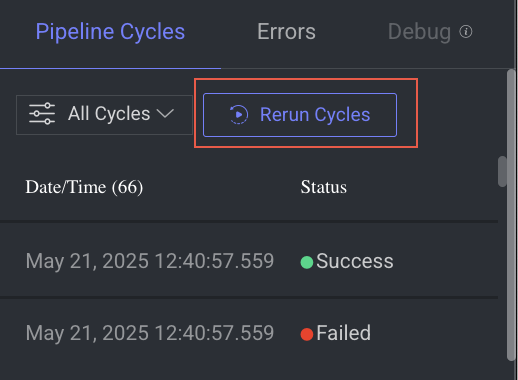
Select the cycles from the list. Use the cycle status filter, if required.
Click
#. A Rerun cycle popup is displayed. Before confirming, choose from the following execution cycle types: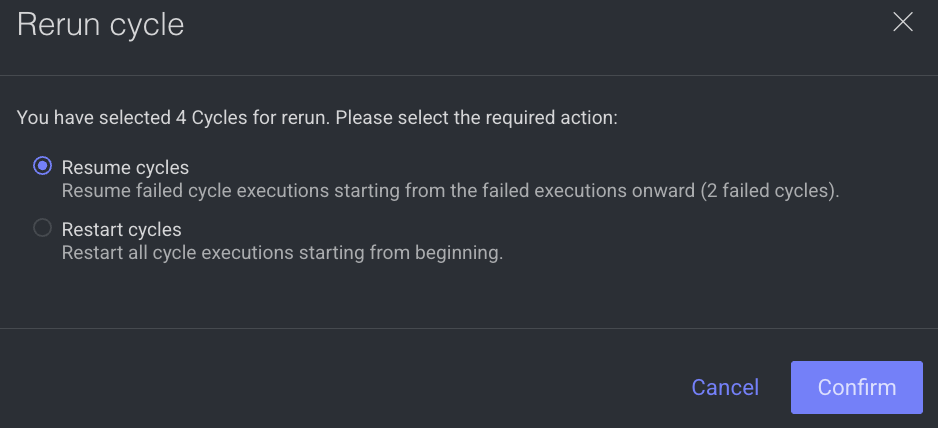
Resume Cycle: Continues the selected executions from the current node onward.
Restart Cycle: Restarts the entire execution cycle from the beginning.
Click .
View Cycle Executions
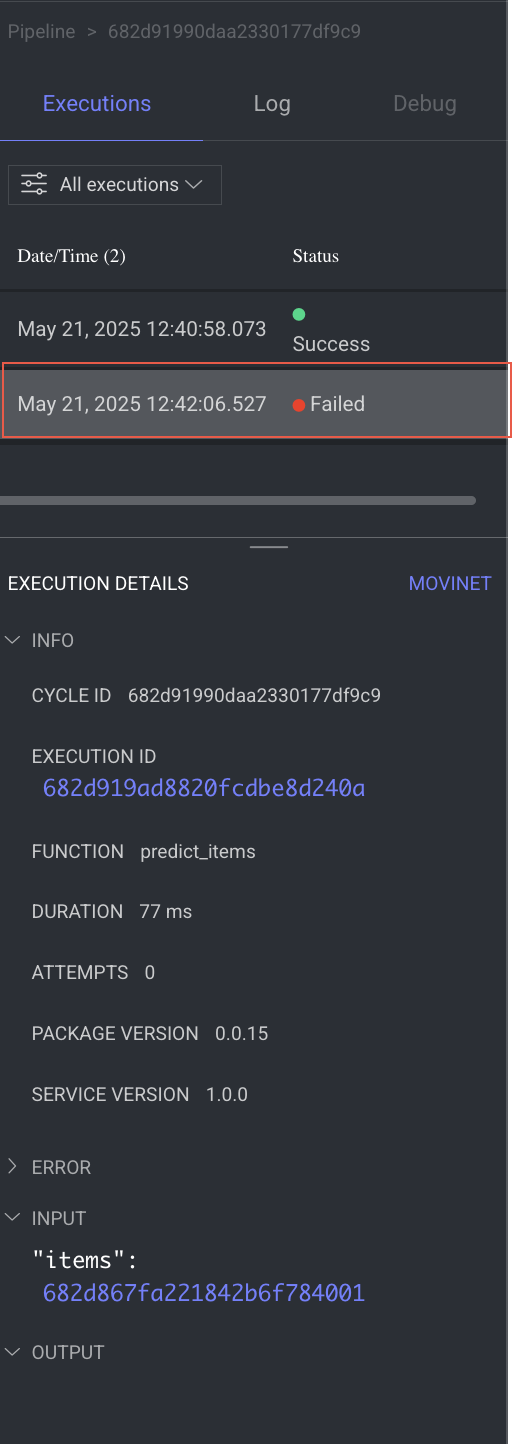
In the Pipeline Cycle list, click on the number of the executions column to drill-in and see each execution. This allows you to browse the executions, see the highlighted node on the Pipeline canvas (which enables you to monitor the item’s progress in the pipeline), and see the execution details (input, output, item with item link, execution time, and duration).

Use the keyboard Up ⬆️ and Down ⬇️ arrows to browse between the executions and trace the item’s progress over the canvas.
Select an execution from the list to see its details, including the function used in the execution, the input, and the output.
Pausing Pipelines
Publishing a Paused Pipeline with Running Cycles
Once pausing a pipeline with any pending/running cycles, the cycles' status will be updated to "Paused" and the cycles will stop running. When resuming the pipeline, a dialog will open offering two options:
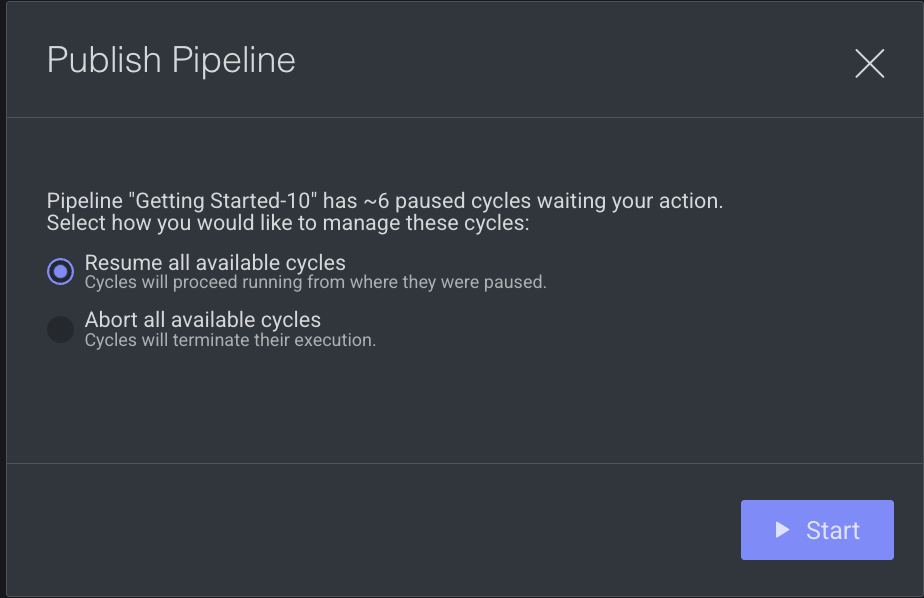
Resume all available cycles (pending/in-progress)
Abort all available cycles (pending/in-progress) - cycles will get "Terminate" status
Aborted Cycles
At the moment, aborted cycles are filtered out automatically from the cycles list in the side panel (can be displayed by filtering cycles with "Terminated" status) and are excluded from the pipeline "statistics bar" counters as well.
If the pipeline was modified while paused and you choose to resume it, the resumed cycles will continue to run according to the new pipeline composition.
Pause Action Limitations
The "pause" action may not immediately halt all pipeline activity. Node executions that have already started running will not be affected, and will only be paused once the current execution is completed. Additionally, it is possible that cycles that are waiting in a node queue at the pause time will be still executed on the node, before being paused.
Pausing Pipelines with Active Event Triggers
You are provided with the option to keep the pipeline event triggers active when the pipeline is paused, so you won't loose events while editing the pipeline. Please click here to read more.
Node Executions
In a DDOE pipeline, each task (called a node) performs a specific function—like running a model, transforming data, or exporting results. A node execution refers to one complete run of that node during a pipeline cycle.
For example, if your pipeline runs daily, then each node in that pipeline will have a new execution each day.
.png)
Node Execution History
You can track the status of each node's executions to monitor progress or debug issues.
Click on any node in the pipeline diagram.
A right-hand panel will open showing a list of executions related to that node.
Executions are listed by their status: success, failed, pending, etc.
Node Executions Status
You can filter the list of executions based on their status. Available status are:

Node Execution Details
When you click on a specific execution, you’ll see detailed information, including:
Info – Basic metadata like timestamps and execution ID.
Input – The data that was sent into the node.
Output – The result produced by the node.
Error – Any error messages, if the execution failed.
If needed, you can rerun executions to improve results or address issues.
Rerun Node Executions
If something went wrong, or you want to improve the output, you can rerun that specific execution directly from the panel. This is helpful when fixing configuration errors or updating models.
Select the Pipelines from the left-side menu.
Open the pipeline from the list.
Select a node from the pipeline. A right-side panel will be displayed.
Click Rerun Executions.
.png)
Select the executions from the list. Use the execution status filter, if required.
Click
#. ARerun Cycles of the Selected Executionspopup is displayed. Before confirming, choose from the following execution cycle types: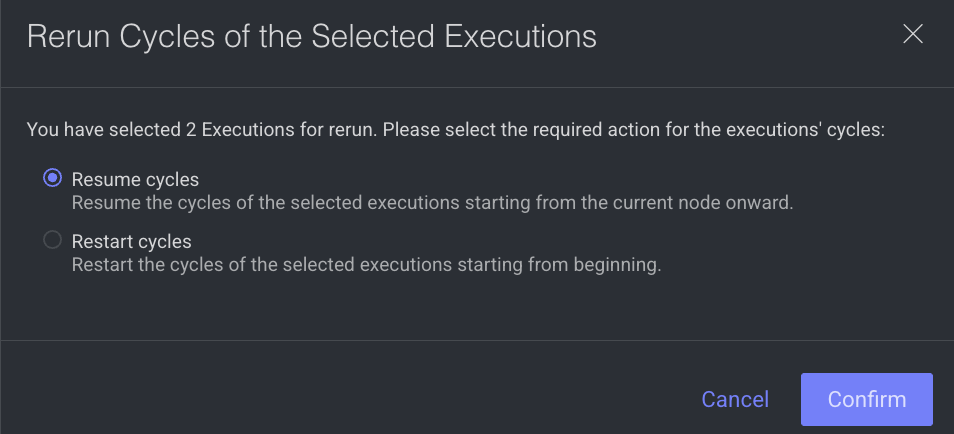
Resume Cycle: Continues the selected executions from the current node onward.
Restart Cycle: Restarts the entire execution cycle from the beginning.
Click .
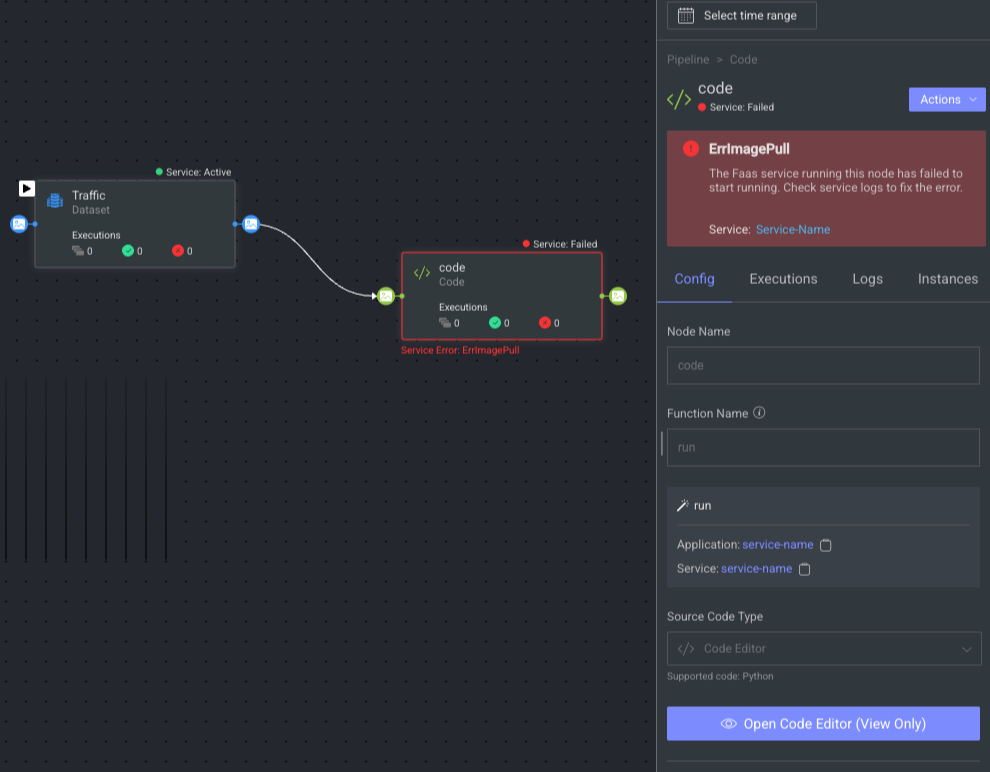
Service Errors
Handling Errors During Service Scale-Up: occurring in the service restart loop can impact Code/FaaS nodes, potentially hindering the scaling up of the node service. The possible causes can be issues with defined requirements or the specified Docker image. When such errors occur, an indicator will be displayed on the corresponding Pipeline node, along with details about the affected service in the services page of the CloudOps.
Pipeline Service Failed - Image Pull Error
The ErrImagePull error occurs when the system fails to pull (download) the container image required to run your pipeline node's service. It means Kubernetes tried to start a container, but couldn't retrieve the image from the container registry (like Docker Hub, AWS ECR, etc.).
Common Causes:
Wrong image name or tag
Missing access credentials (for private registries)
Network issues
Misconfigured pipeline node
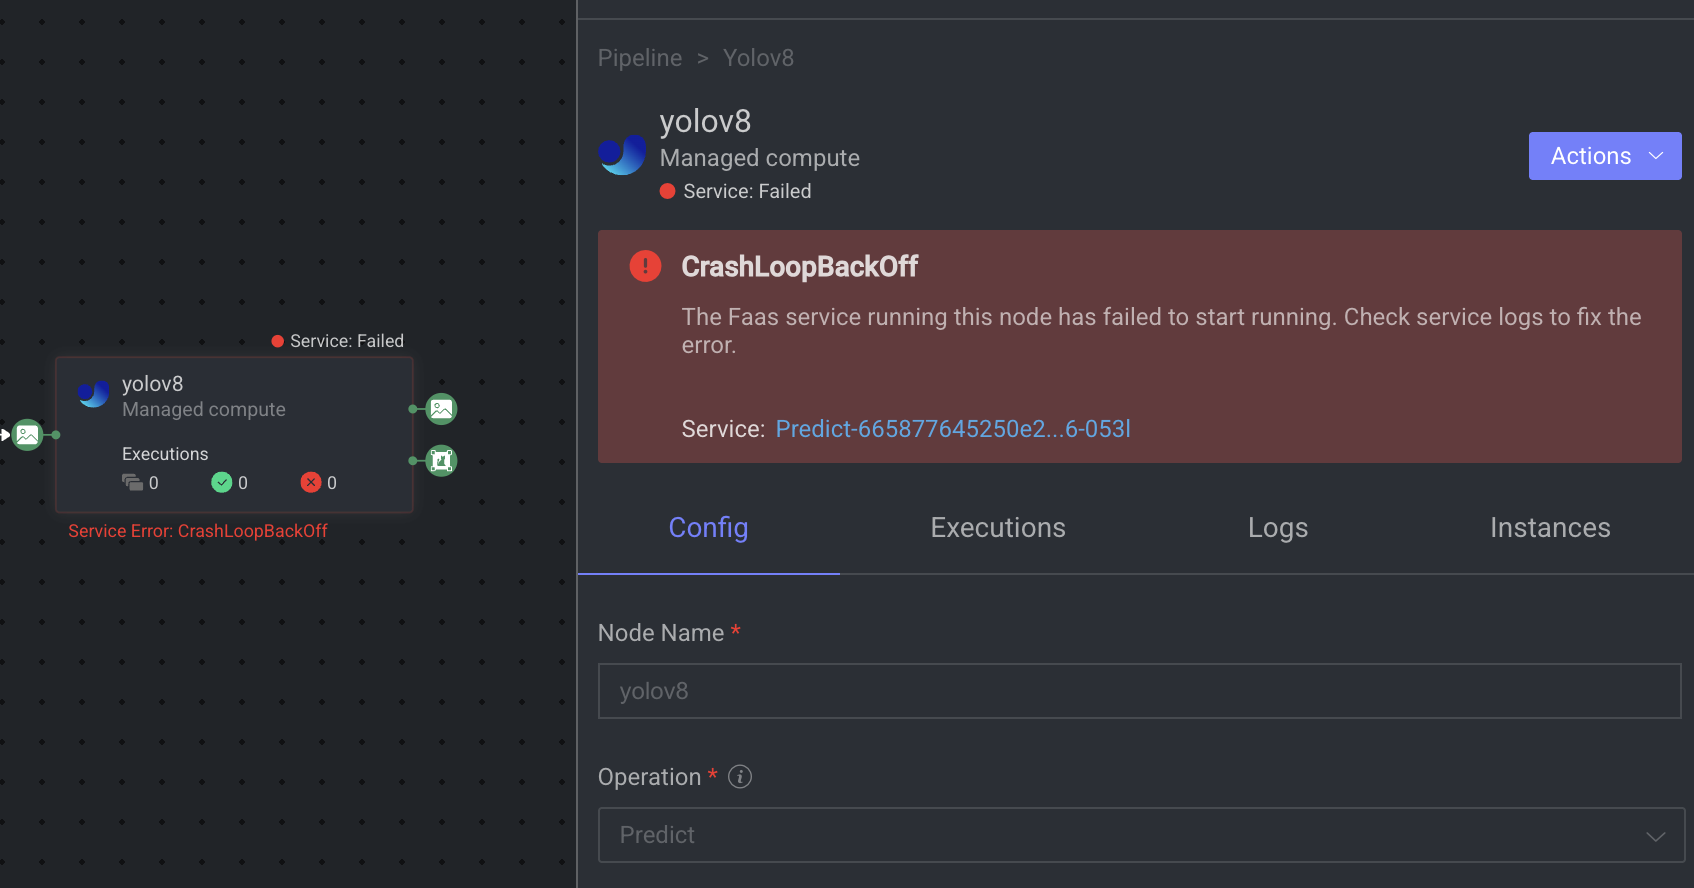
Pipeline Service Failed - Crash Loop Back Off Error
CrashLoopBackOff in DDOE’s Application service means, the function container is crashing repeatedly during startup. This prevents the application node from running your code properly.
Common causes:
Errors in user code (e.g. syntax, missing imports)
Missing dependencies
Misconfigured environment variables
Resource limits (CPU/memory)
Failed external service access (e.g. storage)
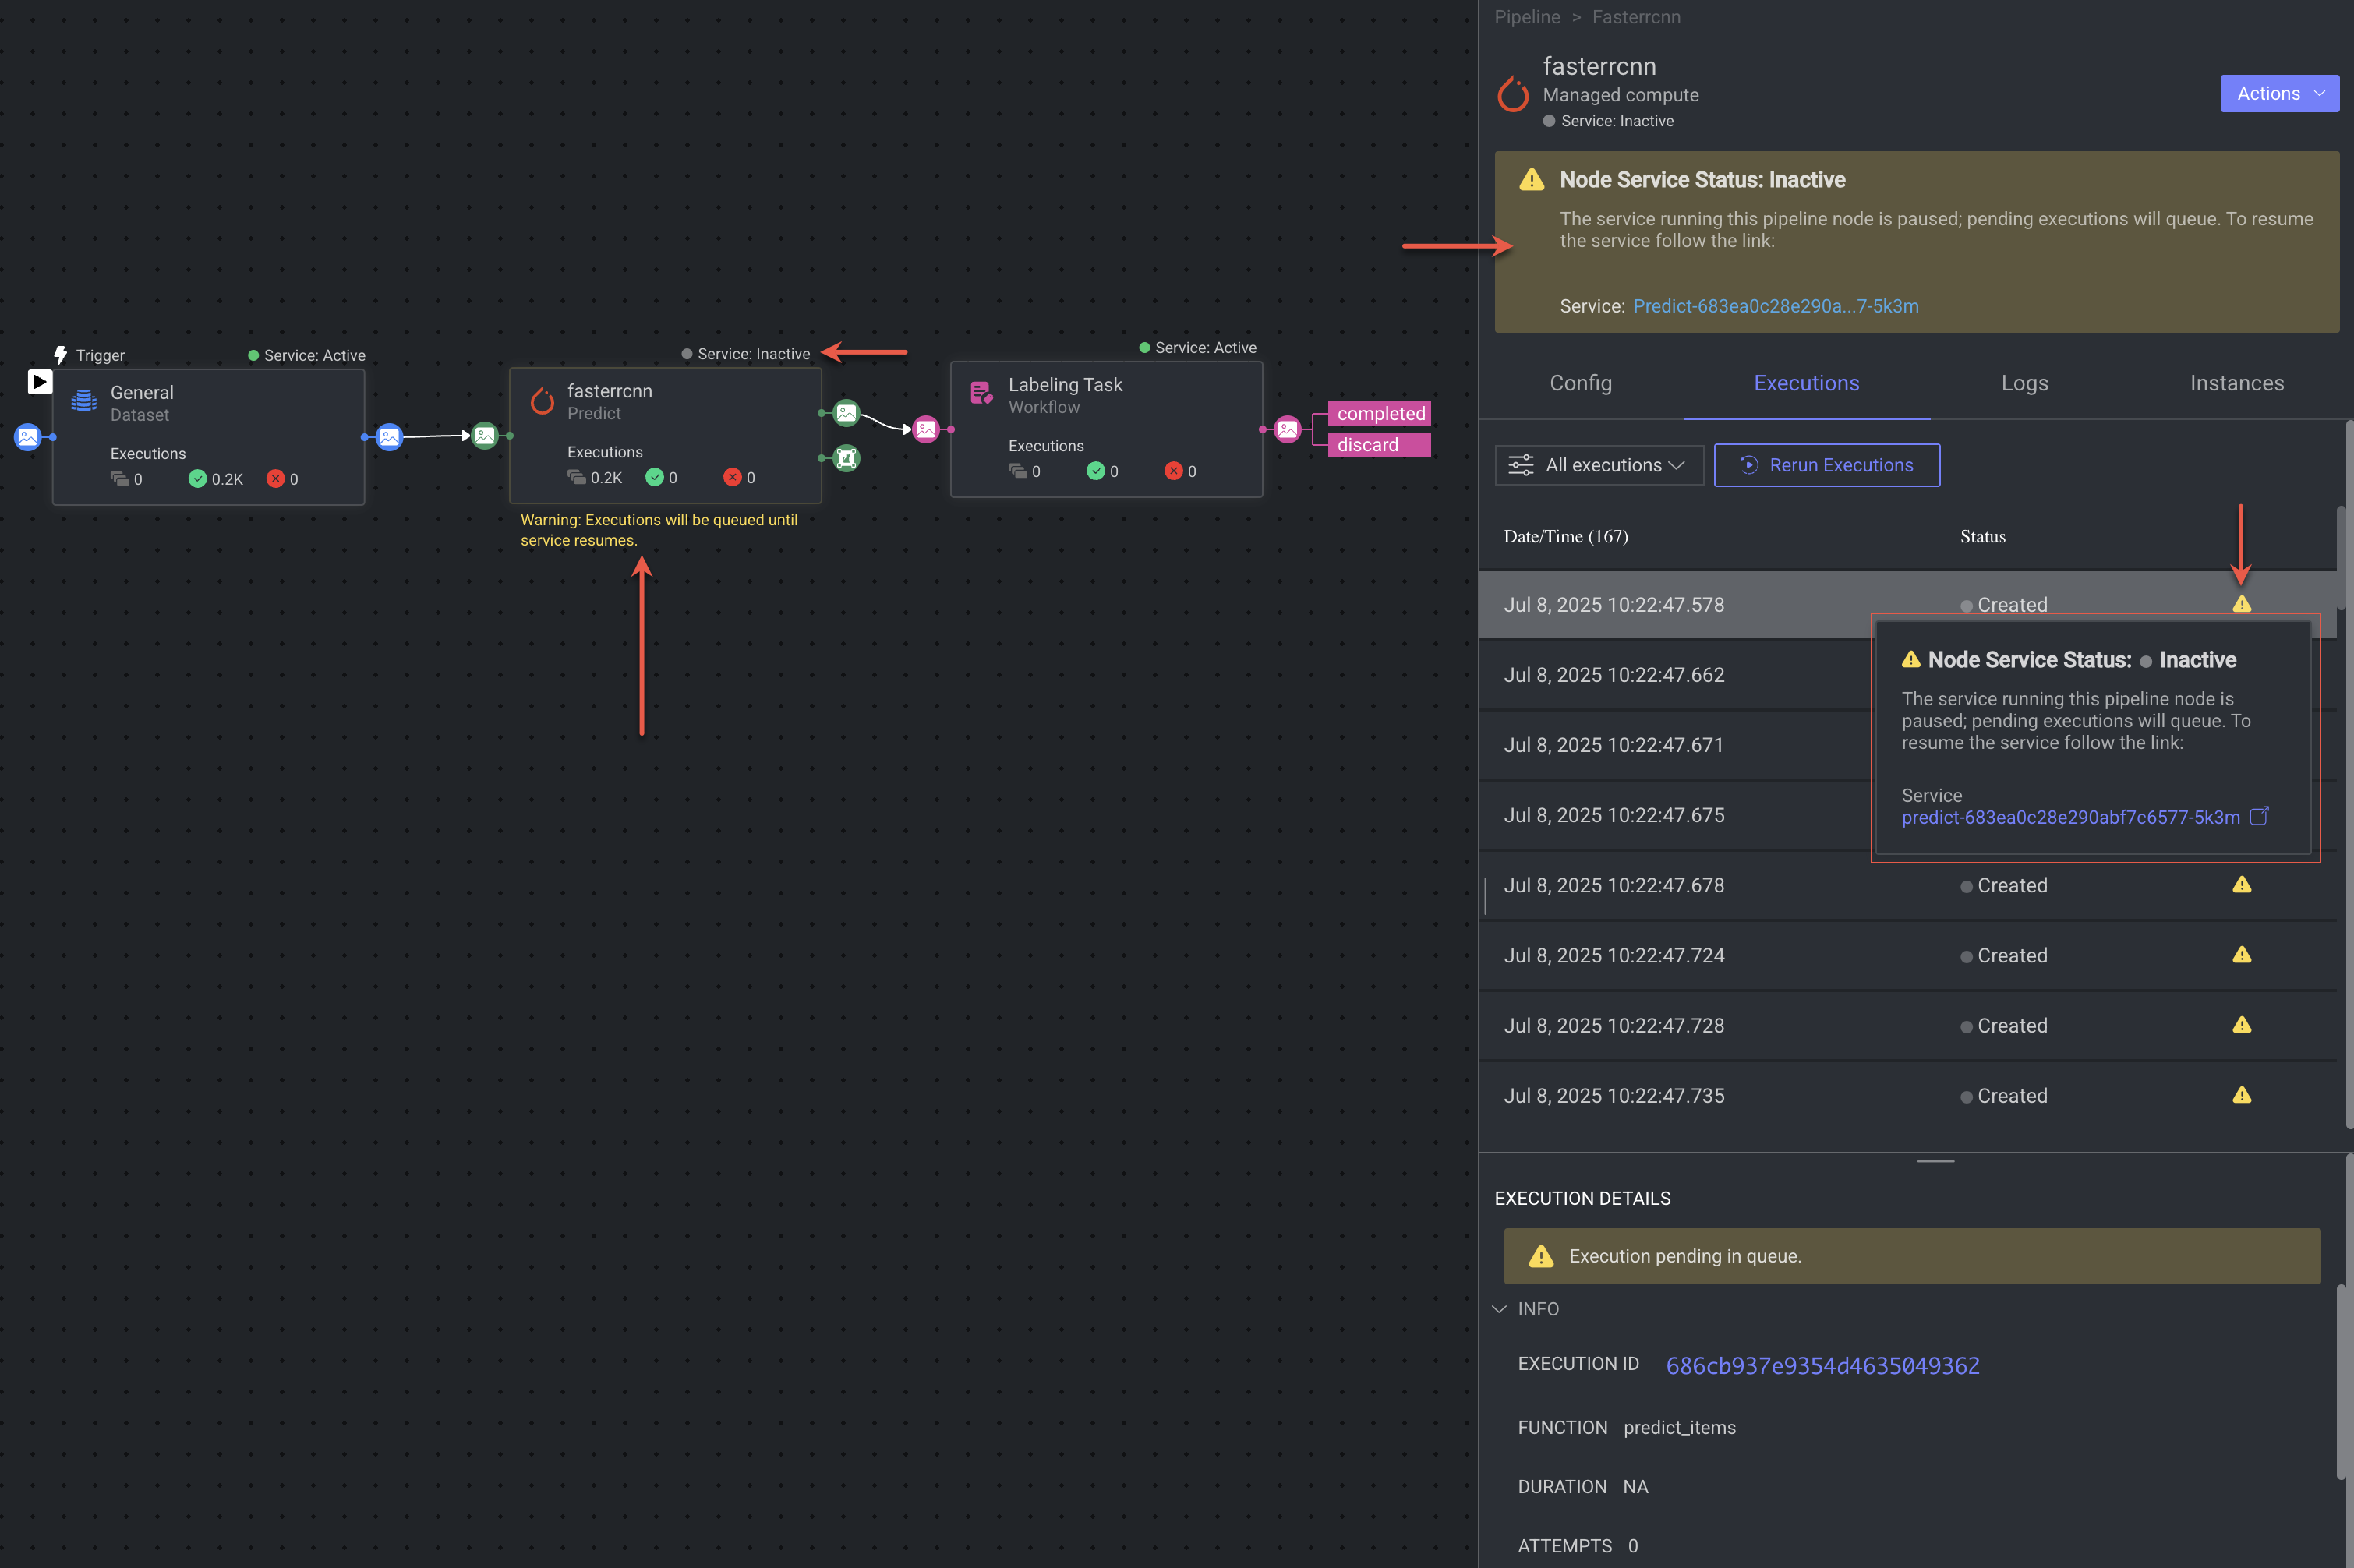
Pipeline Node Service Status - Inactive
This means the pipeline node's service is paused or not running, so any tasks assigned to it will be queued and not processed.
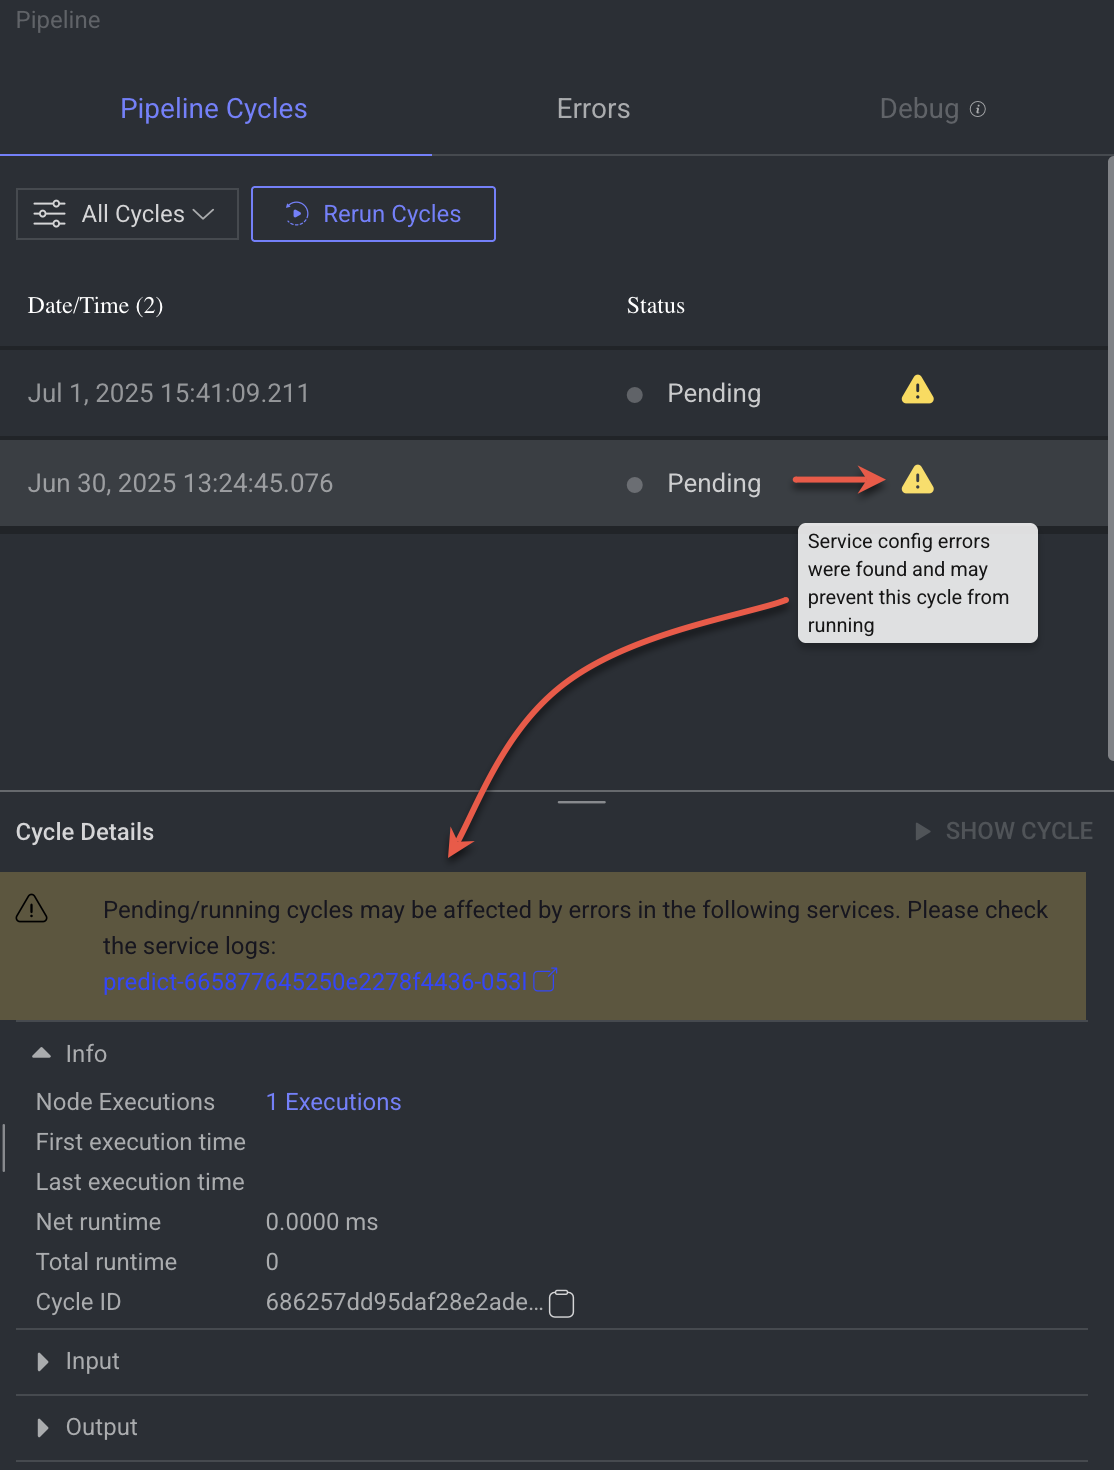
Pending Pipeline Cycle
This means the pipeline can't start because there are configuration errors in the associated service.
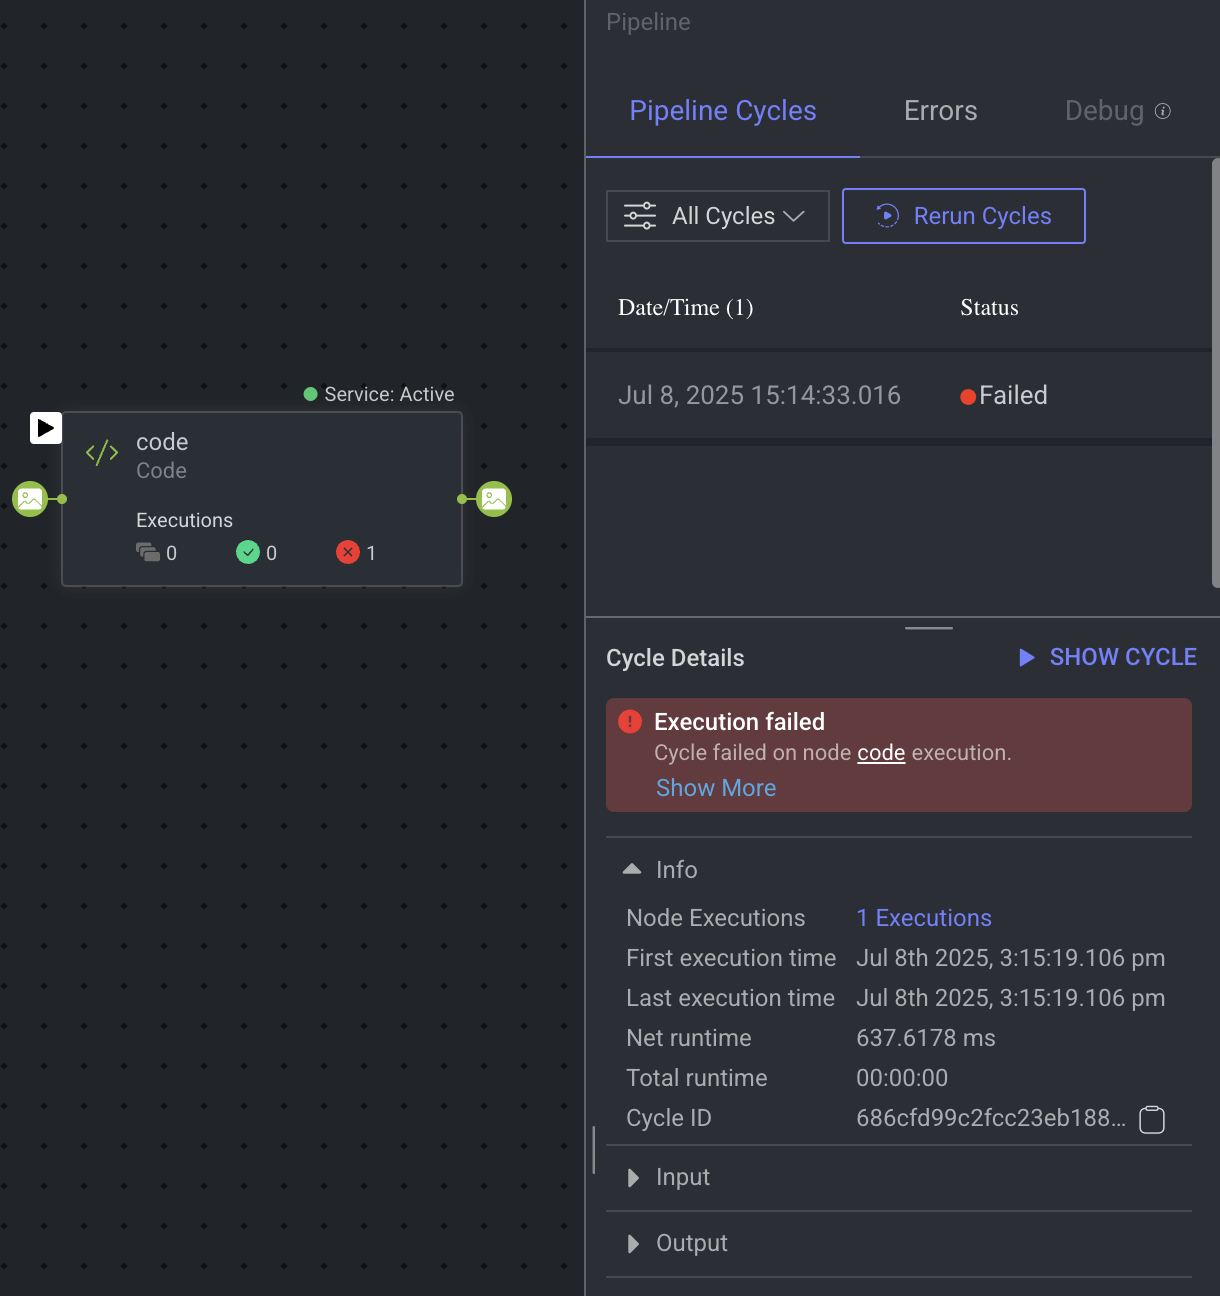
Execution Failed in a Cycle
This means that one or more nodes in the pipeline failed during execution, causing the entire cycle to fail.
Hover over the node name will highlight the particular node on the pipeline canvas.
Click Show More for more details.
Click Show Cycle to view the cycle details.
Click on the Execution link in the Info section at the bottom of the panel will allow you to view more details in the execution level.
Pipeline Node Execution Error Log
This error occurs when a pipeline node attempts to fetch an input resource (such as a dataset, item, or other object) and fails. You can view this error on Exuctions tab of the associated node.
Select the failed pipeline cycle from the Pipeline Cycles tab (as shown in the above screenshot). The Cycle Details section will be displayed at the bottom of the right-side panel.
Click on the Executions link. The Executions tab of the associated node will be displayed.
Select the Failed Execution. The Execution Error Log will be displayed at the bottom of the panel.
.png)
Why This Happens
The input resource may not exist or was deleted.
The node wasn’t configured with a valid input.
A prior node didn’t successfully pass its output.
There’s a mismatch in input names or expected formats.
Pipeline Transition Error
This error means that the pipeline cycle failed while trying to pass output from one node to the next node. One failed reason can be due to invalid input, etc.
The most common reasons are:
Invalid or missing output from the first code node.
Incorrect input format or type expected by the next node.
The previous node did not finish successfully, so no output was passed forward.
Mismatch in the input/output configuration between the nodes.
![]()
Additionally:
Hover over the node name will highlight the particular node on the pipeline canvas.
Click Show More for more details.
Click Show Cycle to view the cycle details.
Click on the Execution link in the Info section at the bottom of the panel will allow you to view more details in the execution level.
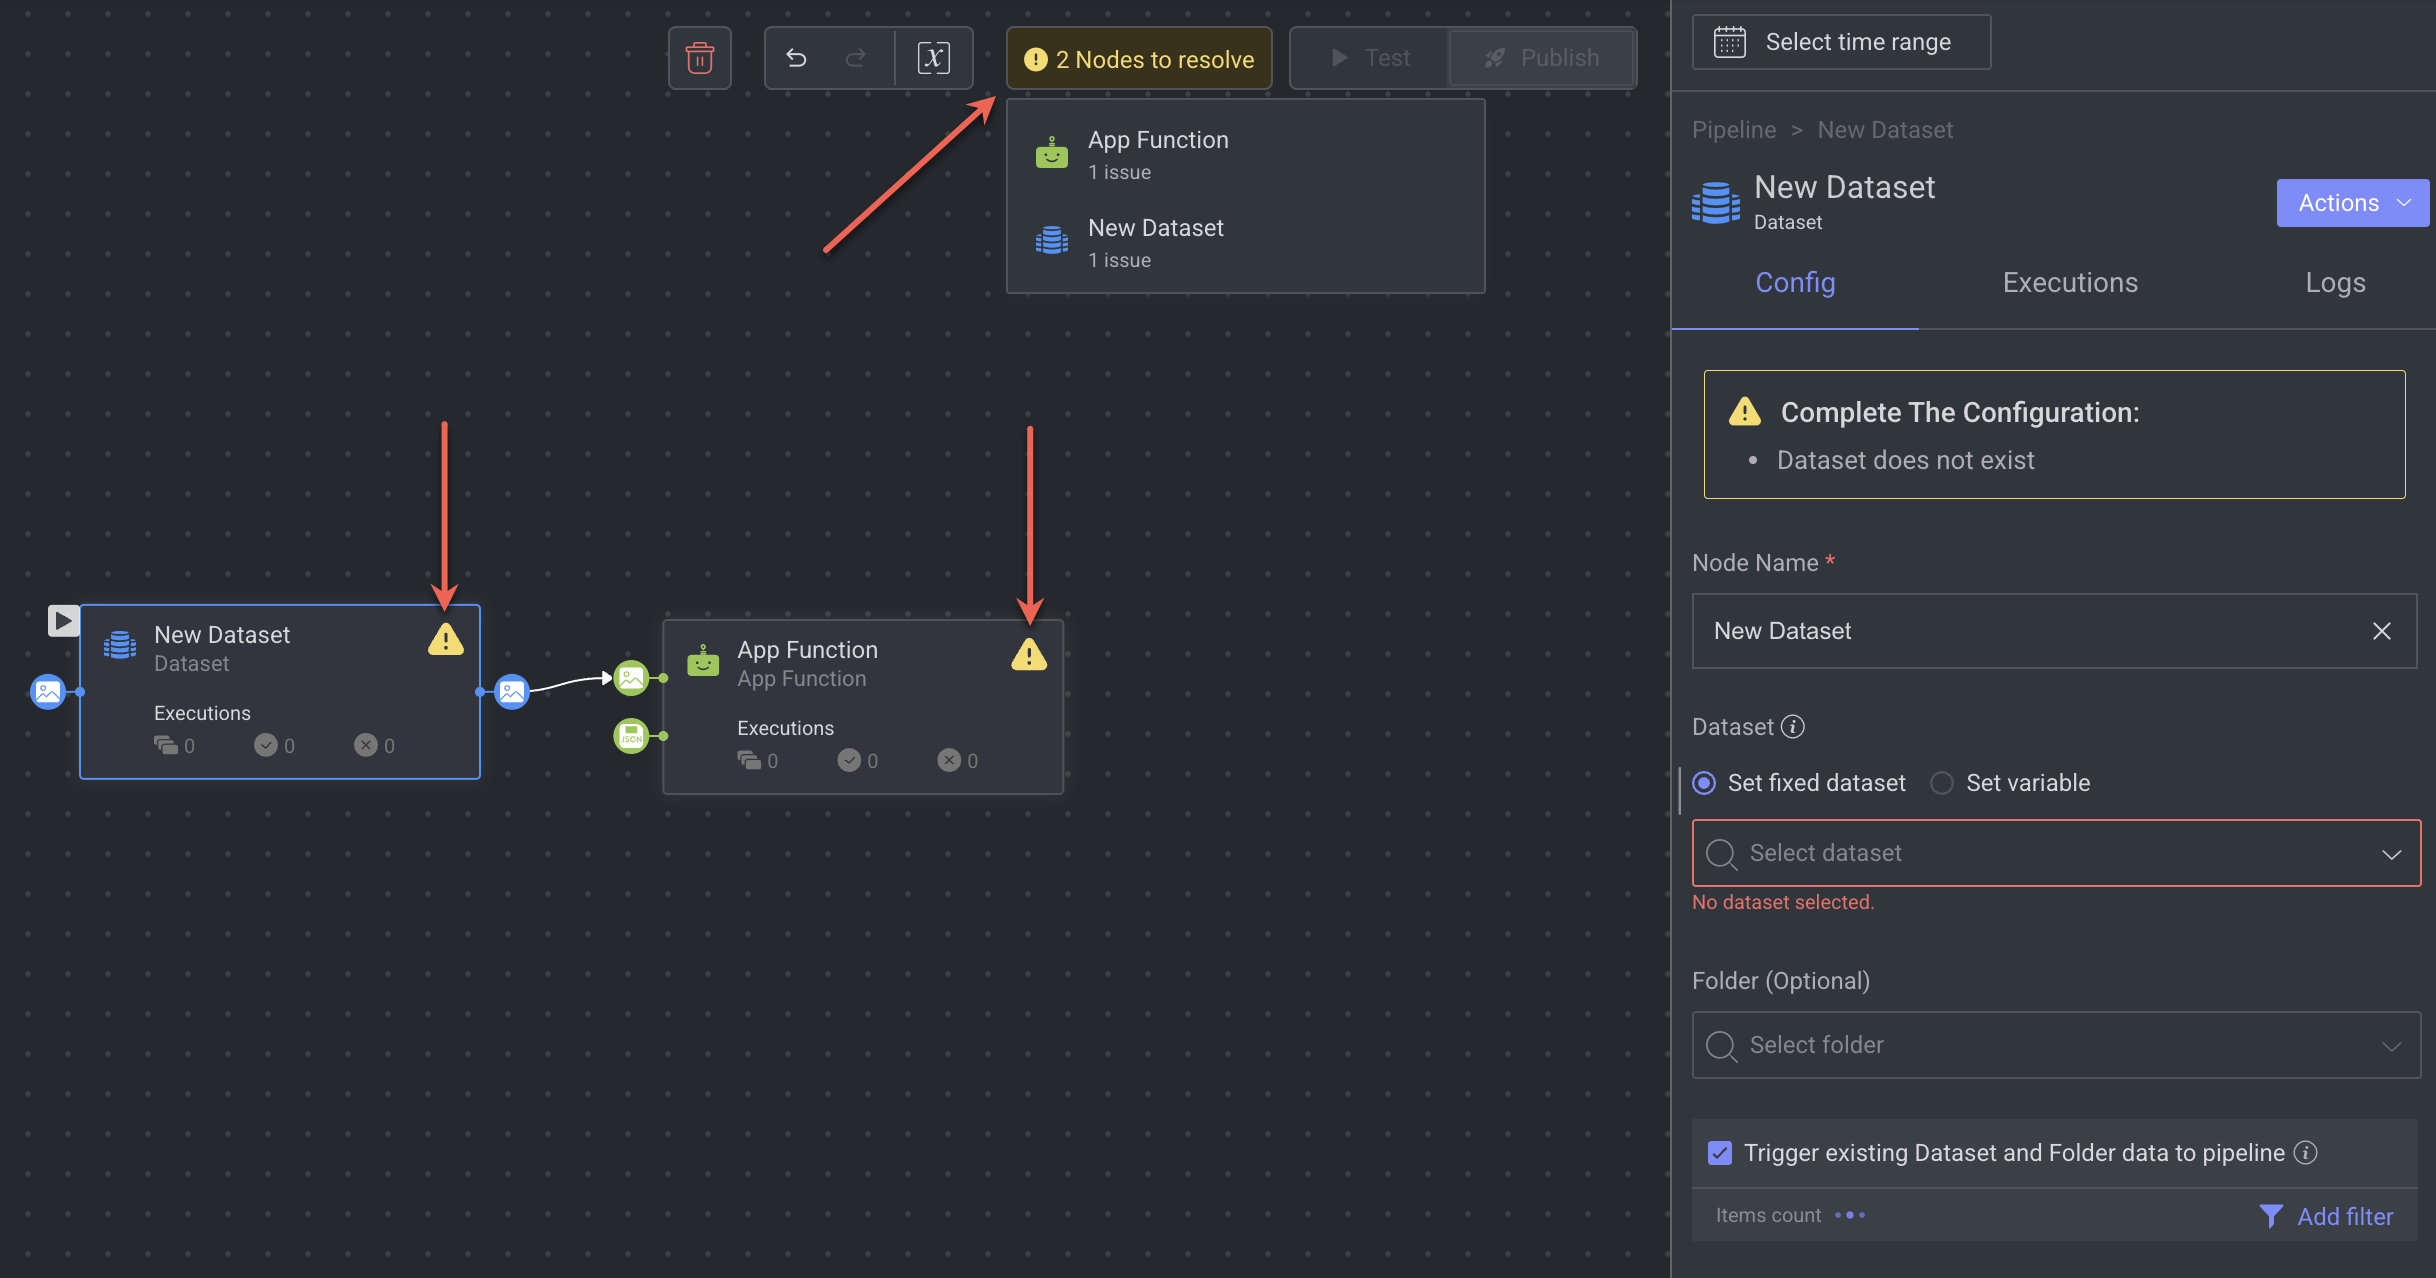
Node Validation Errors
A yellow validation box appears at the top of the pipeline page whenever one or more nodes have validation issues. When all nodes are valid, the bar is hidden.
Counter: Displays the number of affected nodes (not the total number of issues).
Real-time updates: The indicator refreshes automatically as issues are introduced or resolved.
Auto-dismissal: The bar disappears when all node validations are resolved and green.
Clicking on the yellow validation box opens a panel that lists:
All nodes currently failing validation
The issue count per node to support prioritization
Debugging Tool - VS Code
VS Code in DDOE offers an integrated environment for debugging application services and pipeline executions. It features a built-in code editor that allows you to view, edit, and debug code directly within the same platform where your model applications are developed and deployed. For more information on the pipeline node service debugging, refer to the Service Debugging (VS Code) page.
Open the VS Code for the Pipeline Services
To access pipeline-related services directly from the pipeline interface:
Open the Pipeline.
Click on the relevant Node.
In the right-side panel, select Actions > Open Service Page. This will redirect you to the service’s page in CloudOps.
Click on the Service Actions, and select the Open VS Code from the list.
Resolving Execution Failures
After resolving the root cause for any problem that resulted in failing to execute items (e.g. code problems in packages, insufficient compute resources), you can rerun the execution of failed items
From the Right-Side Panel
Select the node.
Switch to the Executions tab.
Select the Failed filter option.
Click Rerun Executions from the list, and follow the steps here.
.png)
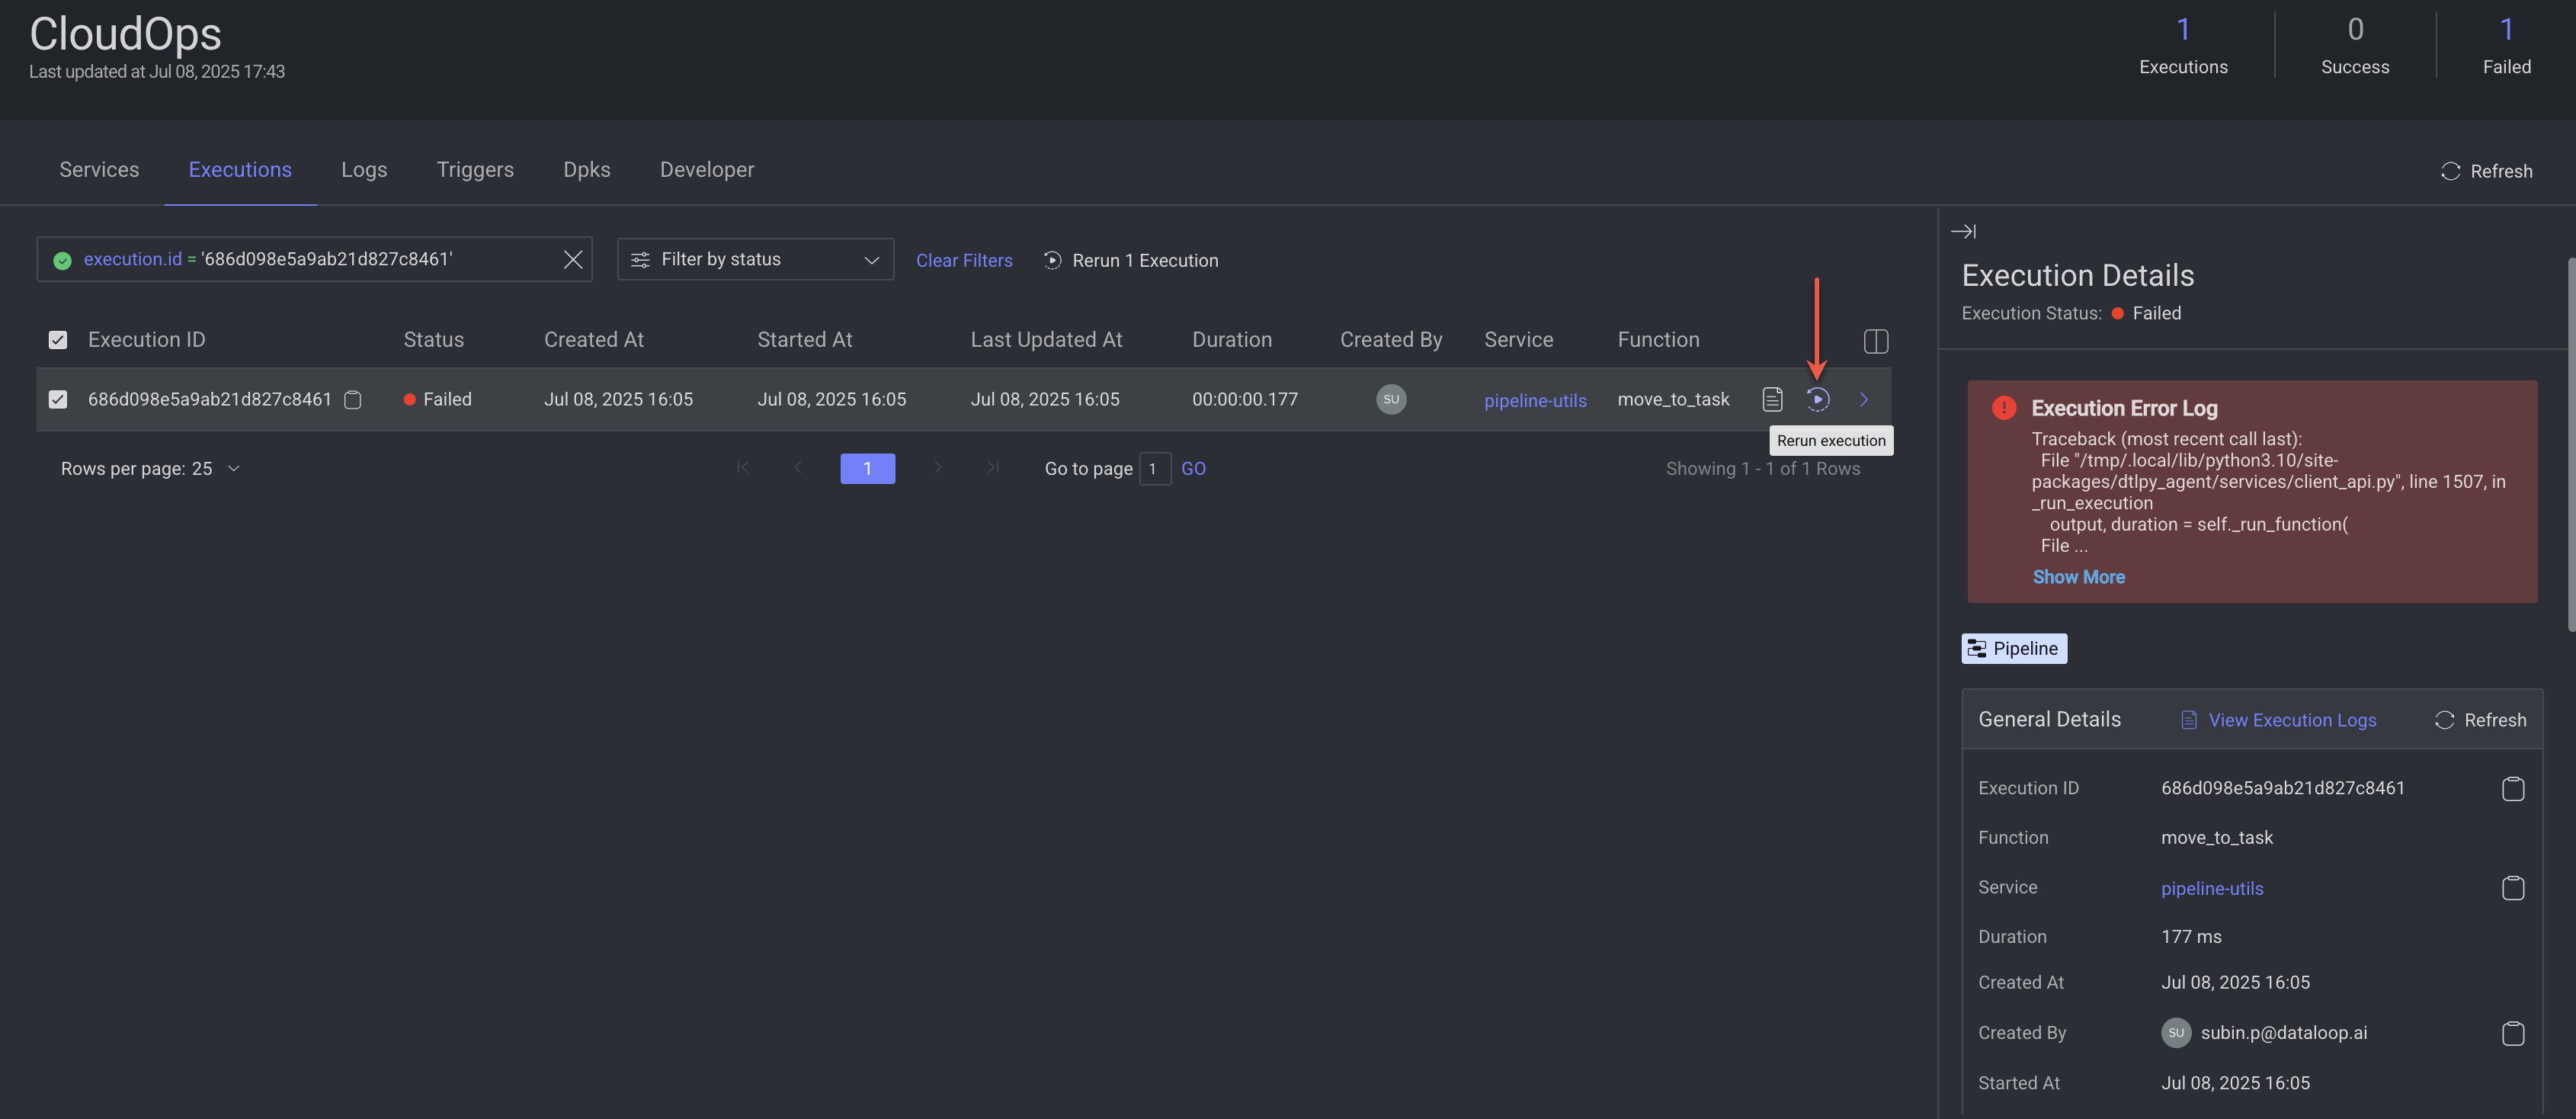
From the CloudOps > Executions page
In the search field, filter by pipeline and by execution.status: failed, and select Rerun All.
Click on the Execution ID from the right-side panel of the Node → Executions. It opens the CloudOps → Executions tab with the execution selected.
.png)
In the CloudOps → Executions tab, click on the Rerun icon after the Function column. A confirmation message is displayed.