Overview
Labeling nodes in the DDOE pipeline manage the annotation process, ensuring high-quality data for machine learning models. These nodes include:
Labeling Task Nodes – Assign and organize annotation tasks for various data types (text, images, audio, video) to streamline dataset creation.
Review Task Nodes – Enhance annotation quality by allowing reviewers to validate, flag, and request corrections for inaccurate annotations.
Consensus Nodes – Automate quality control by comparing multiple annotators' work, ensuring consistency and reducing errors.
Refer to the labeling tasks article to learn more.
Labeling Task Nodes
Use this task to assign and manage annotation tasks as part of your automation workflow, and label your dataset items. Items will continue the pipeline flow once the annotator has completed annotating the item.
The labeling task node allows you to create an annotation task in the pipeline.

Items that are added into the task node, will be added to the task defined in this node.
Items will flow out of the task node based on the status assigned to them by the annotator or reviewer (such as Complete, Approved, Discard, etc.).
The task created from the Task node, will be listed in project tasks (DDOE main menu > Labeling).
Edit task settings in View Mode: The Task Node supports editing of the task settings when the pipeline is running (in View mode).
When you click on a Labeling task node, its details, such as Configuration, Executions, Logs, and available Actions are shown on the right-side panel.
Task Details: Click on Create Labeling Task to create a task. Once the task is created, the following task details are displayed and click on the Edit Task Settings to edit them.
Name: It displays the name of the task. Click on the copy icon to copy the Task ID.
Type: The type of the task, Labeling or QA task.
Quality: It displays the quality task type details, if available.
Owner: The avatar of the task owner. Click on the copy icon to copy the Owner email ID.
Dataset: The dataset name of the task.
Click on the dataset link to open it in the Data browser.
Click on the copy icon to copy the Dataset ID.
Recipe: The recipe name of the task.
Click on the recipe link to open it in the recipe page.
Click on the copy icon to copy the Recipe ID.
Assignments: It displays the number of task assignees. Click on the link to view more details of the assignee, including email ID and Project Role.
Node Settings ->
Rerun items if their task status changes: By default, the process to rerun items once their status changes are enabled. Click here for detailed review.Node Input: Delivered items will be added to the Task managed by this pipeline node. Click Set Parameter to set input parameter for the Task node. For more information, see the Node Inputs article.
Node Output: Statuses will be set automatically according to Task Settings. Click on the plus icon to add the following parameters:
Output name: The of the task output type.
Output type: Task output type, whether it is a task or assignment.
Descriptions (Optional): An optional description.
Actions: By default, the completed action is displayed. It is system generated.
Trigger (Optional): An Event/Cron Triggers can be set on this node, enabling you to initiate the pipeline run from this specific point.
When a node is selected, the Executions tab provides details about the execution of each item processed through that node.
- Choose a specific execution from the list to access its detailed information.
- Dataloop stores executions for a maximum of 90 days.
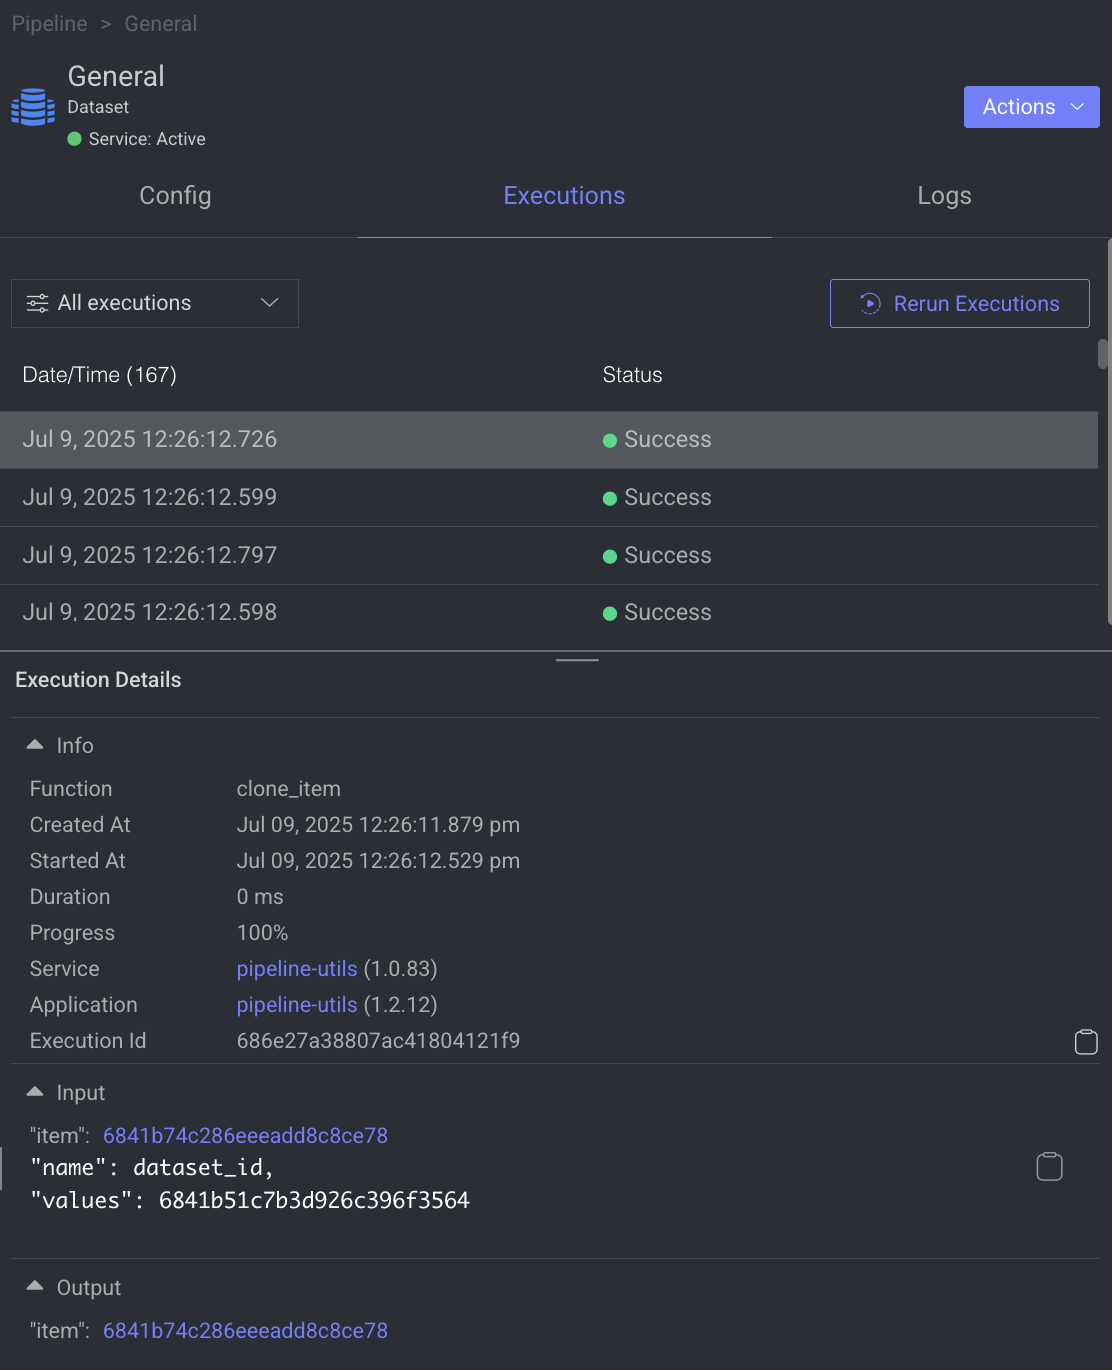
- Use the filter to display executions based on its status.
- Click Rerun Executions to rerun the selected executions. Before you confirm the rerun, you have two actions for the cycles:
- Resume Cycle: Resume the cycles of the selected executions starting from the current node onwards.
- Restart Cycle: Restart the cycles of the selected executions starting from the beginning.
- View Execution details such as Information, Input, and Output.
The Logs tab provides a granular view of what happens behind the scenes when a node executes.
- It showcases all log entries, including function and service level logs, application installation processes (from initialization to completion), generated during executions of the corresponding node within the selected time-frame.
- Dataloop stores logs for a maximum of 14 days.
- Click on the log to view log details in the bottom.
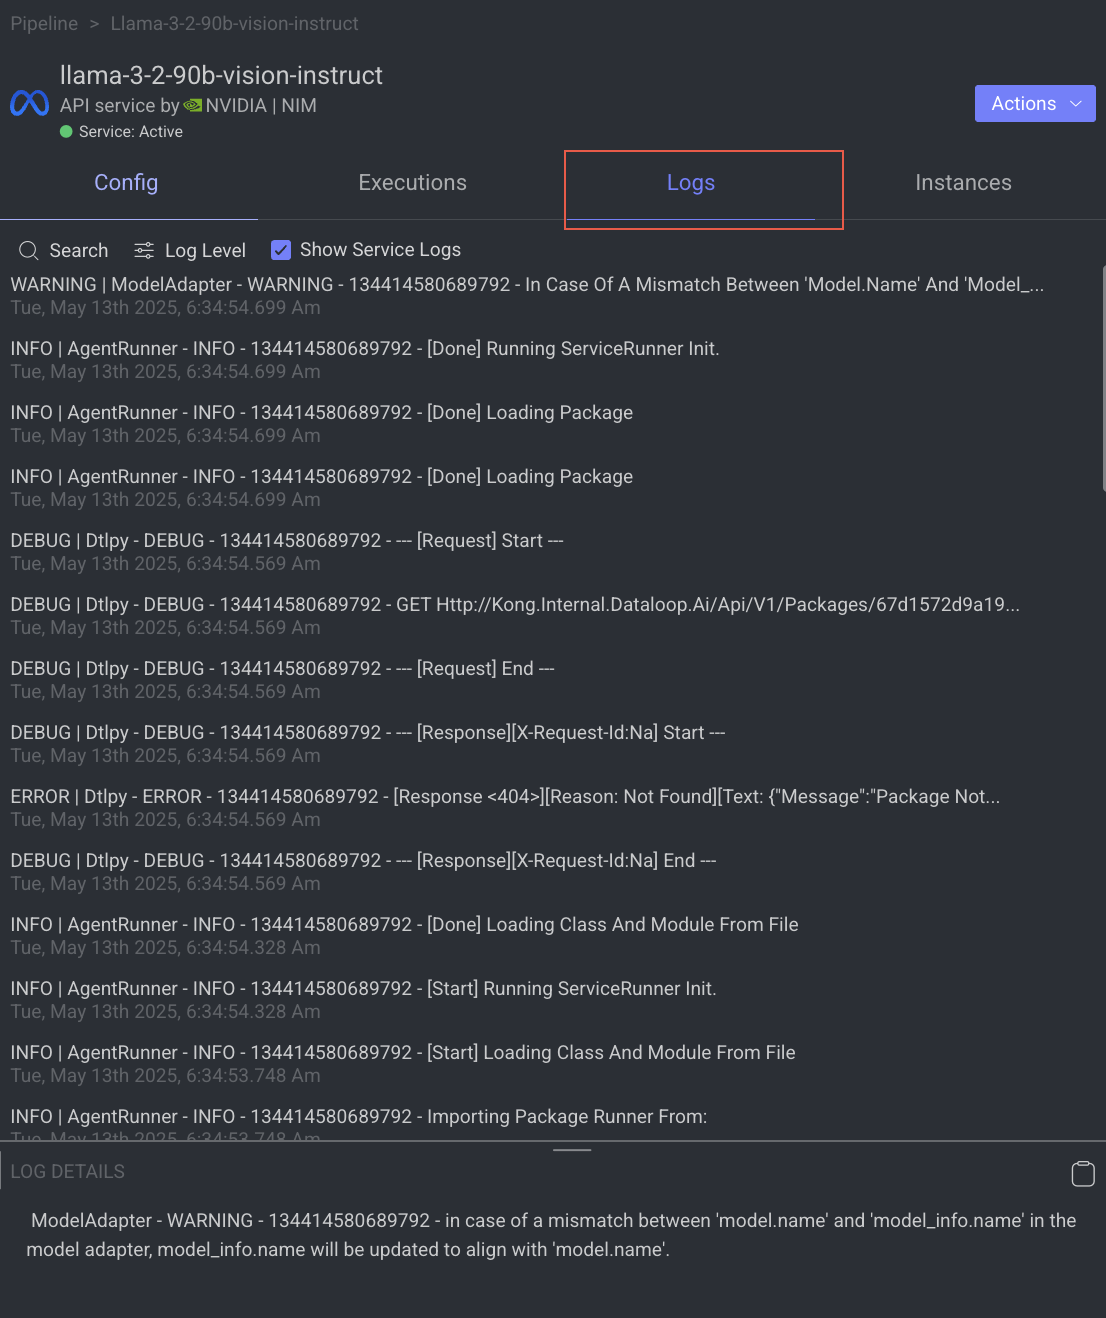
Utilize the following options to navigate through the logs:
- Search: Enter free text to search through the logs.
- Log Level Filter: Filter logs by selecting a level (critical, error, warning, info, debug) to find logs at that level and above.
- Show Service Logs: Show/hide service-level logs, aiding in the debugging and resolution of service-level errors and issues.
Labeling task node allows you to perform the following actions:

Open Task Management Page
It allows you to open and view the Tasks page from a labeling task node, where you view the list view of the selected task.
- Open the Pipelines page and click on the pipeline from the list.
- Select the Labeling node from the pipeline.
- Click on the Action from the right-side panel.
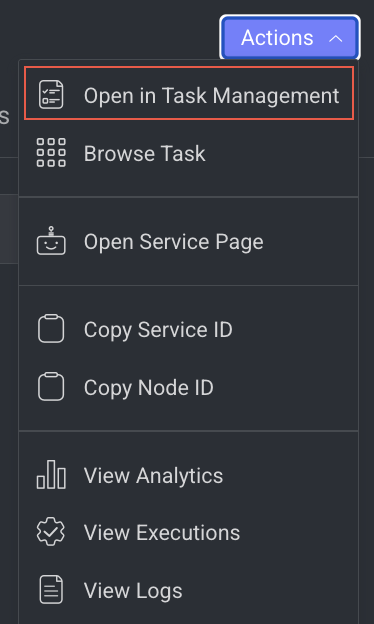
- Click Open in Task Management from the list. The Tasks tab of the Labeling page is displayed.
View Task Browser
It allows you to open and view the task browser page of a labeling task node, where you see the items available for the selected task.
- Open the Pipelines page and click on the pipeline from the list.
- Select a Labeling node from the pipeline.
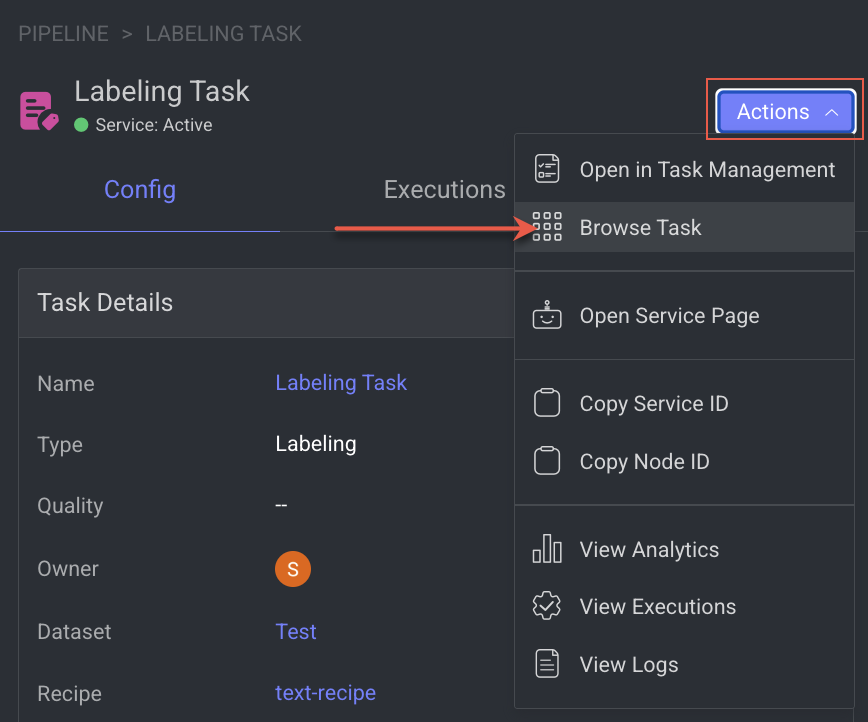
- Click on the Action from the right-side panel.
- Click Browse Task from the list. The task browser page is displayed.
Open the Service Page
Open the service page of a pipeline node where you can see Monitoring, Executions, Logs, Triggers, and Instances information of the service. It will be available once you set a model.
- Open the Pipelines page and click on the pipeline from the list.
- Select the node from the pipeline.
- Click on the Action from the right-side panel.
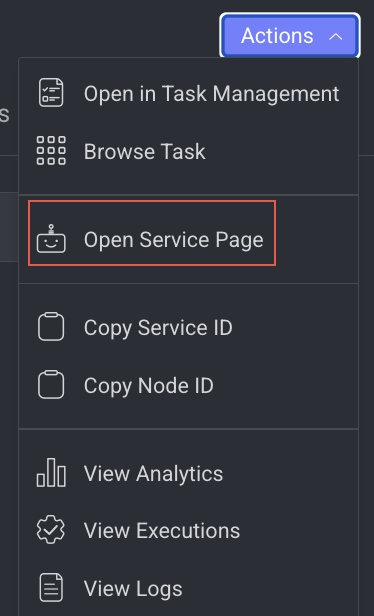
- Click Open Service Page from the list. The Monitoring tab of the service page is displayed.
Copy the Service ID
Copy service ID from a pipeline node.
- Open the Pipelines page and click on the pipeline from the list.
- Select the node from the pipeline.
- Click on the Action from the right-side panel.
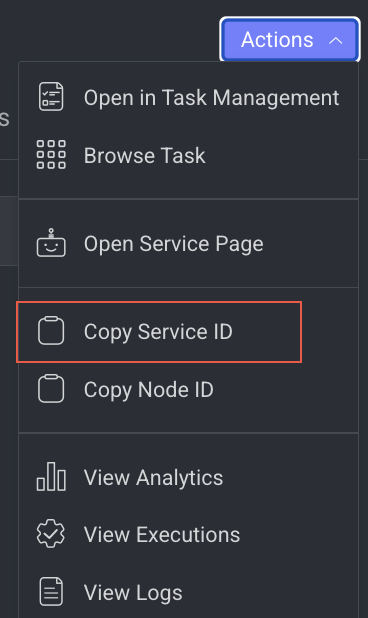
- Click Copy Service ID from the list.
Copy the Node ID
Copy node ID of a pipeline node
- Open the Pipelines page and click on the pipeline from the list.
- Select the node from the pipeline.
- Click on the Action from the right-side panel.
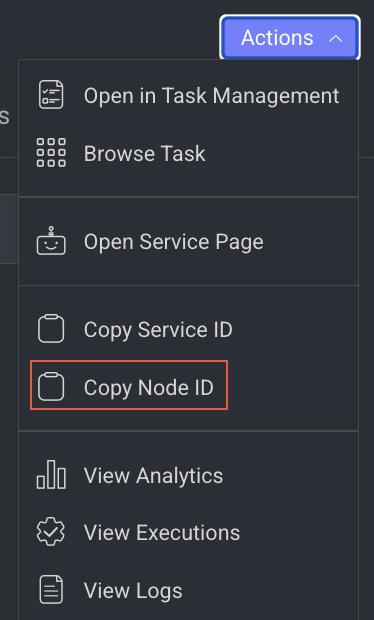
- Click Copy Node ID from the list.
View Analytics Details
It allows you to view the Monitoring tab of the Application Service.
- Open the Pipelines page and click on the pipeline from the list.
- Select the node from the pipeline.
- Click on the Action from the right-side panel.
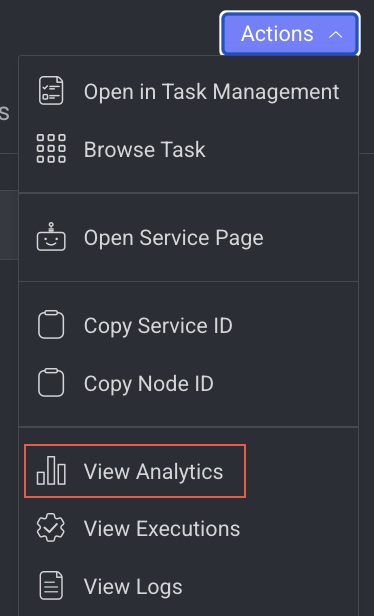
- Click View Analytics from the list. The Monitoring tab of the Application Service page is displayed.
View Execution Details
It allows you to view the Executions page of the Application Service.
- Open the Pipelines page and click on the pipeline from the list.
- Select the node from the pipeline.
- Click on the Action from the right-side panel.
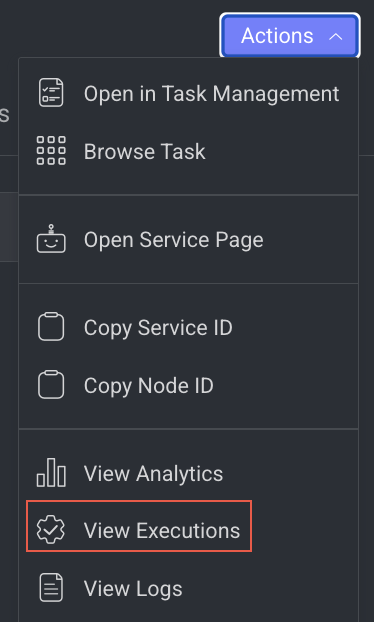
- Click View Executions from the list. The Executions tab of the CloudOps Service page is displayed.
View Log Details
It allows you to view the Logs page of the Application Service from a pipeline node.
- Open the Pipelines page and click on the pipeline from the list.
- Select the node from the pipeline.
- Click on the Action from the right-side panel.
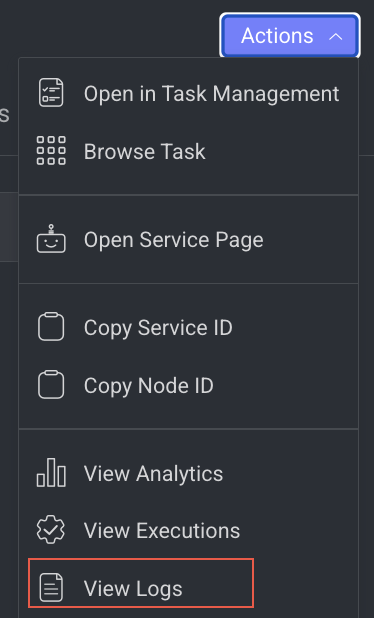
- Click View Logs from the list. The Logs tab of the CloudOps page is displayed.
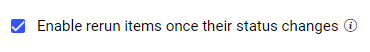
Rerun on Status Change
A checkbox is available on the task node's Config tab to enable re-sending items as the task node outputs when their status becomes updated. As a result, the subsequent pipeline nodes will be re-executed with the same items.
This option is enabled by default and will be updated automatically to all existing pipelines.
For example;
If there are two tasks to complete; the first task has an issue and something has changed in its status, the process won’t go back. Every change in status from the task is a kind of trigger and will cause its running to reoccur.
For example, if there are two annotation tasks, such as:
Annotation of a cat
Annotation of a dog
The annotator inaccurately labeled the 'dog,' prompting the QA team to raise an issue. Consequently, the item's status will be changed to 'In progress' in the pipeline and returned to the annotator. The status will only transition to 'Completed' once the second task is finished. This procedure is also applicable when the annotator updates the status.
The code in the pipeline below will be executed only once, even if the item has been completed.
Checkpoints
Checkpoint for Task/Assignment Completion: You have the option to create a temporary checkpoint between a Workflow node (task) and its next node, which will remain until the task or assignment managed by the node is completed. This will cause the execution of the subsequent node in the cycle to be put on hold until the completion event occurs.
To use this functionality, follow these steps:
Add a Workflow node to the canvas and configure the task as desired.
Create another output on the Workflow node you just added, specifying its type as either a task or an assignment (according to the checkpoint you wish to create).
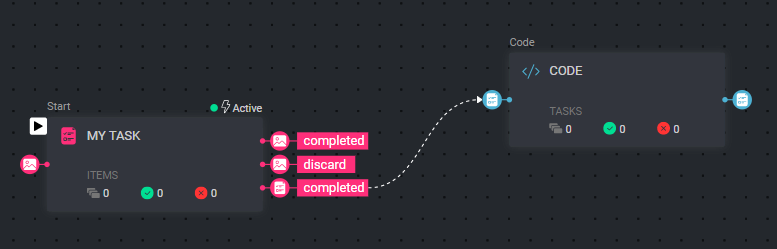
Connect the output of the Task/Assignment to any Task/Assignment input in the nodes you wish to delay the running of until the Task/Assignment is complete. You will see a dotted line indicating the connection between the nodes. Task/Assignment inputs can be set on Code and FaaS nodes.
By setting the above, every cycle created in the pipeline will pause at the Workflow node, waiting for the completion of the Task/Assignment before executing the subsequent node. The cycle's status will remain as "In progress".
Keep in mind that this functionality alters the pipeline context from running on your data (items) to running on the task/assignment. The items can be extracted from the task/assignment context.
Dotted line connection
The dotted line connecting the nodes also indicates that a new cycle will be initiated with a task/assignment context once the completion event triggers the subsequent node.
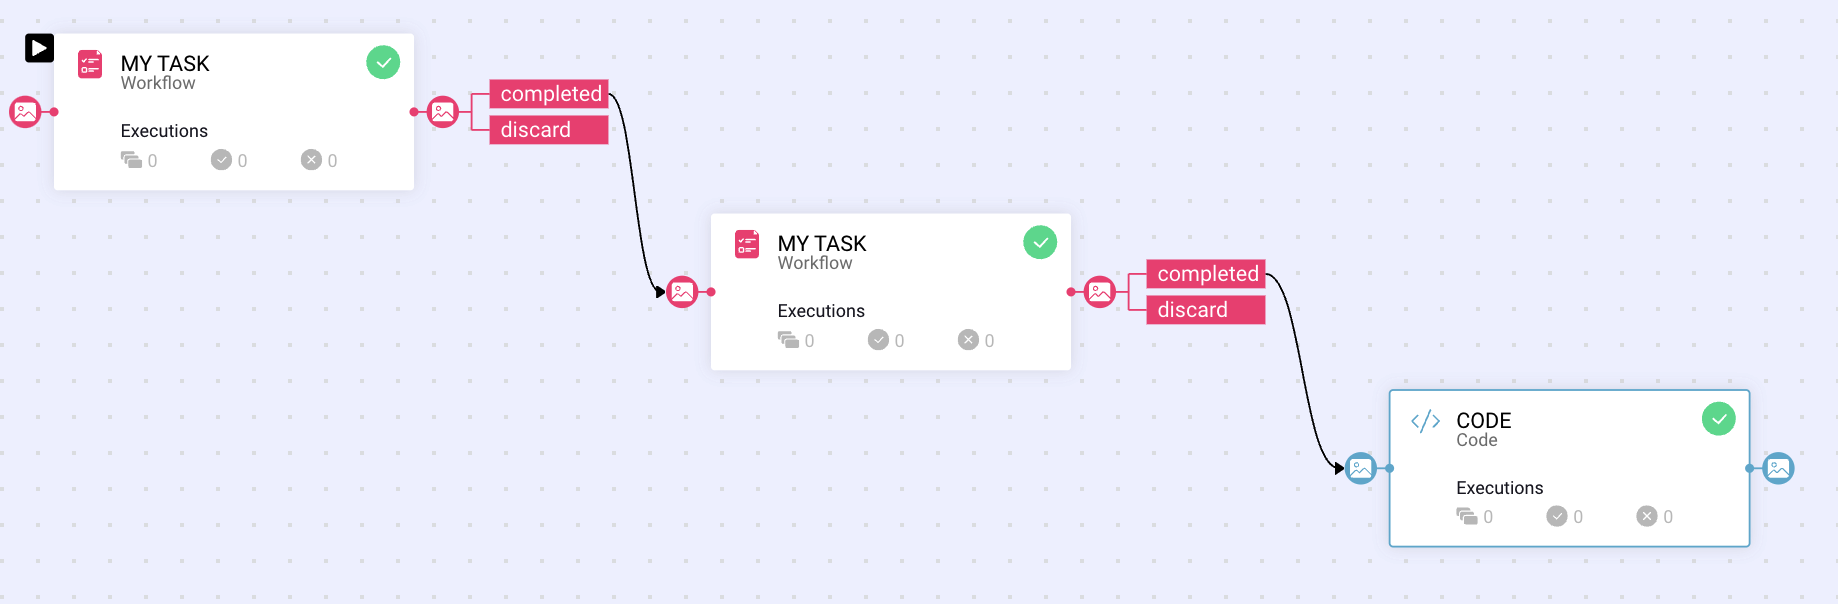
Checkpoint Example
In the following example, the initial node (workflow) receives items as inputs, a pipeline cycle will be generated for each item. Upon node execution, the item is passed to the task created by the node. The code snippet node is triggered only after all the task items were given a status by the task assignees, and an event is fired. A new pipeline cycle is created to indicate this special flow with a new context.
Review Task Nodes
Set up a QA task to review and validate annotations. Items will continue the pipeline flow once the review is completed, ensuring quality control across your workflow.
The review task node allows you to create a review task in the pipeline.

When you click on a review task node, its details, such as Configuration, Executions, Logs, and available Actions are shown on the right-side panel.
Task Details: Click on Create Review Task to create a task. Once the task is created, the following task details are displayed and click on the Edit Task Settings to edit them.
Name: It displays the name of the task. Click on the copy icon to copy the Task ID.
Type: The type of the task, Labeling or QA task.
Quality: It displays the quality task type details, if available.
Owner: The avatar of the task owner. Click on the copy icon to copy the Owner email ID.
Dataset: The dataset name of the task.
Click on the dataset link to open it in the Data browser.
Click on the copy icon to copy the Dataset ID.
Recipe: The recipe name of the task.
Click on the recipe link to open it in the recipe page.
Click on the copy icon to copy the Recipe ID.
Assignments: It displays the number of task assignees. Click on the link to view more details of the assignee, including email ID and Project Role.
Node Settings ->
Rerun items if their task status changes: By default, the process to rerun items once their status changes are enabled. Click here for detailed review.Node Input: Delivered items will be added to the Task managed by this pipeline node. Click Set Parameter to set input parameter for the Task node. For more information, see the Node Inputs article.
Node Output: Statuses will be set automatically according to Task Settings. Click on the plus icon to add the following parameters:
Output name: The of the task output type.
Output type: Task output type, whether it is a task or assignment.
Descriptions (Optional): An optional description.
Actions: By default, the completed action is displayed. It is system generated.
Trigger (Optional): An Event/Cron Triggers can be set on this node, enabling you to initiate the pipeline run from this specific point.
When a node is selected, the Executions tab provides details about the execution of each item processed through that node.
- Choose a specific execution from the list to access its detailed information.
- Dataloop stores executions for a maximum of 90 days.
- Use the filter to display executions based on its status.
- Click Rerun Executions to rerun the selected executions. Before you confirm the rerun, you have two actions for the cycles:
- Resume Cycle: Resume the cycles of the selected executions starting from the current node onwards.
- Restart Cycle: Restart the cycles of the selected executions starting from the beginning.
- View Execution details such as Information, Input, and Output.
The Logs tab provides a granular view of what happens behind the scenes when a node executes.
- It showcases all log entries, including function and service level logs, application installation processes (from initialization to completion), generated during executions of the corresponding node within the selected time-frame.
- Dataloop stores logs for a maximum of 14 days.
- Click on the log to view log details in the bottom.
Utilize the following options to navigate through the logs:
- Search: Enter free text to search through the logs.
- Log Level Filter: Filter logs by selecting a level (critical, error, warning, info, debug) to find logs at that level and above.
- Show Service Logs: Show/hide service-level logs, aiding in the debugging and resolution of service-level errors and issues.
Review task node allows you to perform the following actions:

Open Task Management Page
It allows you to open and view the Tasks page from a labeling task node, where you view the list view of the selected task.
- Open the Pipelines page and click on the pipeline from the list.
- Select the Labeling node from the pipeline.
- Click on the Action from the right-side panel.
- Click Open in Task Management from the list. The Tasks tab of the Labeling page is displayed.
View Task Browser
It allows you to open and view the task browser page of a labeling task node, where you see the items available for the selected task.
- Open the Pipelines page and click on the pipeline from the list.
- Select a Labeling node from the pipeline.
- Click on the Action from the right-side panel.
- Click Browse Task from the list. The task browser page is displayed.
Open the Service Page
Open the service page of a pipeline node where you can see Monitoring, Executions, Logs, Triggers, and Instances information of the service. It will be available once you set a model.
- Open the Pipelines page and click on the pipeline from the list.
- Select the node from the pipeline.
- Click on the Action from the right-side panel.
- Click Open Service Page from the list. The Monitoring tab of the service page is displayed.
Copy the Service ID
Copy service ID from a pipeline node.
- Open the Pipelines page and click on the pipeline from the list.
- Select the node from the pipeline.
- Click on the Action from the right-side panel.
- Click Copy Service ID from the list.
Copy the Node ID
Copy node ID of a pipeline node
- Open the Pipelines page and click on the pipeline from the list.
- Select the node from the pipeline.
- Click on the Action from the right-side panel.
- Click Copy Node ID from the list.
View Analytics Details
It allows you to view the Monitoring tab of the Application Service.
- Open the Pipelines page and click on the pipeline from the list.
- Select the node from the pipeline.
- Click on the Action from the right-side panel.
- Click View Analytics from the list. The Monitoring tab of the Application Service page is displayed.
View Execution Details
It allows you to view the Executions page of the Application Service.
- Open the Pipelines page and click on the pipeline from the list.
- Select the node from the pipeline.
- Click on the Action from the right-side panel.
- Click View Executions from the list. The Executions tab of the CloudOps Service page is displayed.
View Log Details
It allows you to view the Logs page of the Application Service from a pipeline node.
- Open the Pipelines page and click on the pipeline from the list.
- Select the node from the pipeline.
- Click on the Action from the right-side panel.
- Click View Logs from the list. The Logs tab of the CloudOps page is displayed.
Consensus Task Nodes
Set up a Consensus task to compare annotations from multiple users. Items will continue the pipeline flow once a majority-vote consensus is reached, ensuring high-quality, reliable data through distributed reviews.

When you click on a consensus task node, its details, such as Configuration, Executions, Logs, and available Actions are shown on the right-side panel.
Task Details: Click on Create Consensus Task to create a task. Once the task is created, the following task details are displayed and click on the Edit Task Settings to edit them.
Name: It displays the name of the task. Click on the copy icon to copy the Task ID.
Type: The type of the task, Labeling type.
Quality: It displays the quality task type as consensus.
Owner: The avatar of the task owner. Click on the copy icon to copy the Owner email ID.
Dataset: The dataset name of the task.
Click on the dataset link to open it in the Data browser.
Click on the copy icon to copy the Dataset ID.
Recipe: The recipe name of the task.
Click on the recipe link to open it in the recipe page.
Click on the copy icon to copy the Recipe ID.
Assignments: It displays the number of task assignees. Click on the link to view more details of the assignee, including email ID and Project Role.
Node Settings ->
Rerun items if their task status changes: By default, the process to rerun items once their status changes are enabled. Click here for detailed review.Node Input: Delivered items will be added to the Task managed by this pipeline node. Click Set Parameter to set input parameter for the Task node. For more information, see the Node Inputs article.
Node Output: Statuses will be set automatically according to Task Settings. Click on the plus icon to add the following parameters:
Output name: The of the task output type.
Output type: Task output type, whether it is a task or assignment.
Descriptions (Optional): An optional description.
Actions: By default, the completed action is displayed. It is system generated.
Trigger (Optional): An Event/Cron Triggers can be set on this node, enabling you to initiate the pipeline run from this specific point.
When a node is selected, the Executions tab provides details about the execution of each item processed through that node.
- Choose a specific execution from the list to access its detailed information.
- Dataloop stores executions for a maximum of 90 days.
- Use the filter to display executions based on its status.
- Click Rerun Executions to rerun the selected executions. Before you confirm the rerun, you have two actions for the cycles:
- Resume Cycle: Resume the cycles of the selected executions starting from the current node onwards.
- Restart Cycle: Restart the cycles of the selected executions starting from the beginning.
- View Execution details such as Information, Input, and Output.
The Logs tab provides a granular view of what happens behind the scenes when a node executes.
- It showcases all log entries, including function and service level logs, application installation processes (from initialization to completion), generated during executions of the corresponding node within the selected time-frame.
- Dataloop stores logs for a maximum of 14 days.
- Click on the log to view log details in the bottom.
Utilize the following options to navigate through the logs:
- Search: Enter free text to search through the logs.
- Log Level Filter: Filter logs by selecting a level (critical, error, warning, info, debug) to find logs at that level and above.
- Show Service Logs: Show/hide service-level logs, aiding in the debugging and resolution of service-level errors and issues.
Consensus task node allows you to perform the following actions:

Open Task Management Page
It allows you to open and view the Tasks page from a labeling task node, where you view the list view of the selected task.
- Open the Pipelines page and click on the pipeline from the list.
- Select the Labeling node from the pipeline.
- Click on the Action from the right-side panel.
- Click Open in Task Management from the list. The Tasks tab of the Labeling page is displayed.
View Task Browser
It allows you to open and view the task browser page of a labeling task node, where you see the items available for the selected task.
- Open the Pipelines page and click on the pipeline from the list.
- Select a Labeling node from the pipeline.
- Click on the Action from the right-side panel.
- Click Browse Task from the list. The task browser page is displayed.
Open the Service Page
Open the service page of a pipeline node where you can see Monitoring, Executions, Logs, Triggers, and Instances information of the service. It will be available once you set a model.
- Open the Pipelines page and click on the pipeline from the list.
- Select the node from the pipeline.
- Click on the Action from the right-side panel.
- Click Open Service Page from the list. The Monitoring tab of the service page is displayed.
Copy the Service ID
Copy service ID from a pipeline node.
- Open the Pipelines page and click on the pipeline from the list.
- Select the node from the pipeline.
- Click on the Action from the right-side panel.
- Click Copy Service ID from the list.
Copy the Node ID
Copy node ID of a pipeline node
- Open the Pipelines page and click on the pipeline from the list.
- Select the node from the pipeline.
- Click on the Action from the right-side panel.
- Click Copy Node ID from the list.
View Analytics Details
It allows you to view the Monitoring tab of the Application Service.
- Open the Pipelines page and click on the pipeline from the list.
- Select the node from the pipeline.
- Click on the Action from the right-side panel.
- Click View Analytics from the list. The Monitoring tab of the Application Service page is displayed.
View Execution Details
It allows you to view the Executions page of the Application Service.
- Open the Pipelines page and click on the pipeline from the list.
- Select the node from the pipeline.
- Click on the Action from the right-side panel.
- Click View Executions from the list. The Executions tab of the CloudOps Service page is displayed.
View Log Details
It allows you to view the Logs page of the Application Service from a pipeline node.
- Open the Pipelines page and click on the pipeline from the list.
- Select the node from the pipeline.
- Click on the Action from the right-side panel.
- Click View Logs from the list. The Logs tab of the CloudOps page is displayed.