The Automation elements of the DDOE pipeline consist of App Function and Code nodes, which enable efficient, scalable automation within machine learning workflows.
Code Node
The Code Node allows you to run custom Python code in your pipeline. Write the logic, configure the runtime environment, and adjust resources as needed. It is ideal for handling lightweight tasks such as uploading annotations in JSON format, cropping annotations from items, generating bounding boxes, and more.
When the pipeline is triggered, a dedicated service is deployed to run the code. This service may require monitoring, maintenance, and scaling depending on the workload and operational needs.
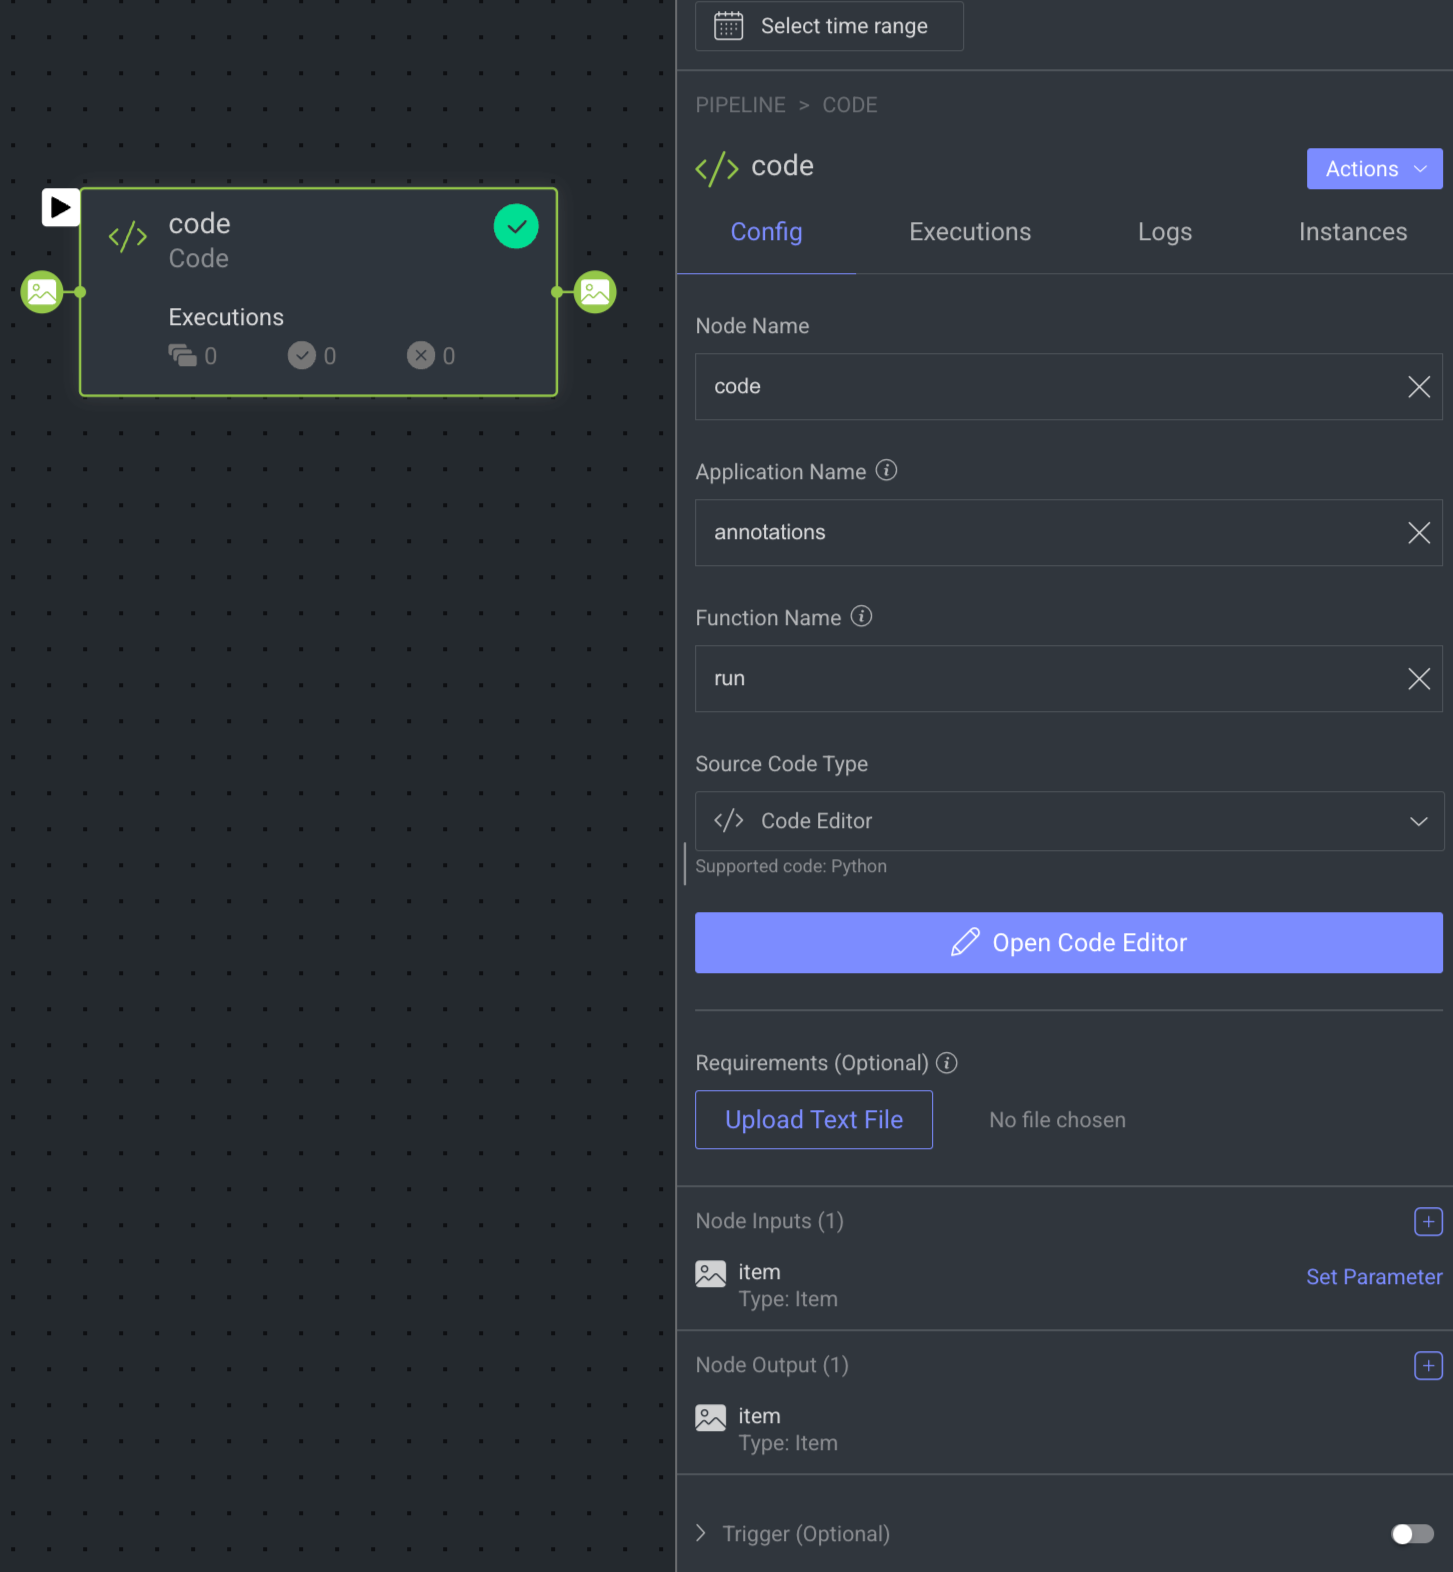
When you click on a Code Node, its details, such as Configuration, Executions, Logs, Instances, and available Actions are shown on the right-side panel. The Code Node details are presented in four tabs as follows:
Node Name: By default, code is displayed as name. You can change accordingly.
Application Name: Provide a name for the application that will be created to execute this code node. This name will be used as both the package and service names.
Function Name: Provide a name for the function that will run your code. Make sure to use the same name as defined in the code, following the Python convention for function names. By default, run is displayed as name.
Source Code Type: Select a source code type from the following list.
Code Editor(by default): The Code Editor allows you to enter the code for the code node.Upload ZIP: It allows you to upload your code in a.zipfile.Connect GitHub: It allows you to enter the URL of your code's Git repository and Git Tag.
Requirements (Optional): It allows you to upload the requirements file in
.txtformat.This file is necessary when your code relies on additional Python libraries for execution, and it helps specify which Python libraries need to be installed.
Alternatively, a docker image can be specified in docker image URL while editing a service. Also, see the Custom Docker Image article for more information about the docker registry.
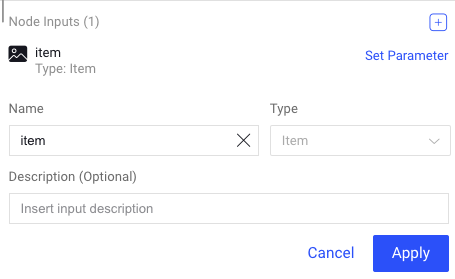
Node Inputs: Input channels are set to be of type: item by default. A Code node can have multiple input and output channels. You can perform the following:
Add new inputs by clicking on the plus icon. It allows you to add a new name, new input type, and description.
Click on the Pencil icon to update Name and Description. You cannot edit the type.
Click Set Parameter to set input parameter for the Code node.
For more information, see the Node Inputs article.
Node Outputs: Output channels are set to be of type: item by default. You can perform the following:
Add new outputs by clicking on the plus icon. It allows you to add a new name, new output type, description, and action.
Click on the Pencil icon to update Name, Description, and Actions. You cannot edit the type.
When adding output channels, you may need to choose a different type for your output. For example, if a code node connects to another code node that expects a boolean as an input, you will need to define the output of the first code node to be of type boolean.
Important
Recommended uploading your code as a package to our Application, and using it as a App Function node rather than code. This will enable you to better manage versions, reuse the service, and more.
When a node is selected, the Executions tab provides details about the execution of each item processed through that node.
- Choose a specific execution from the list to access its detailed information.
- Dataloop stores executions for a maximum of 90 days.
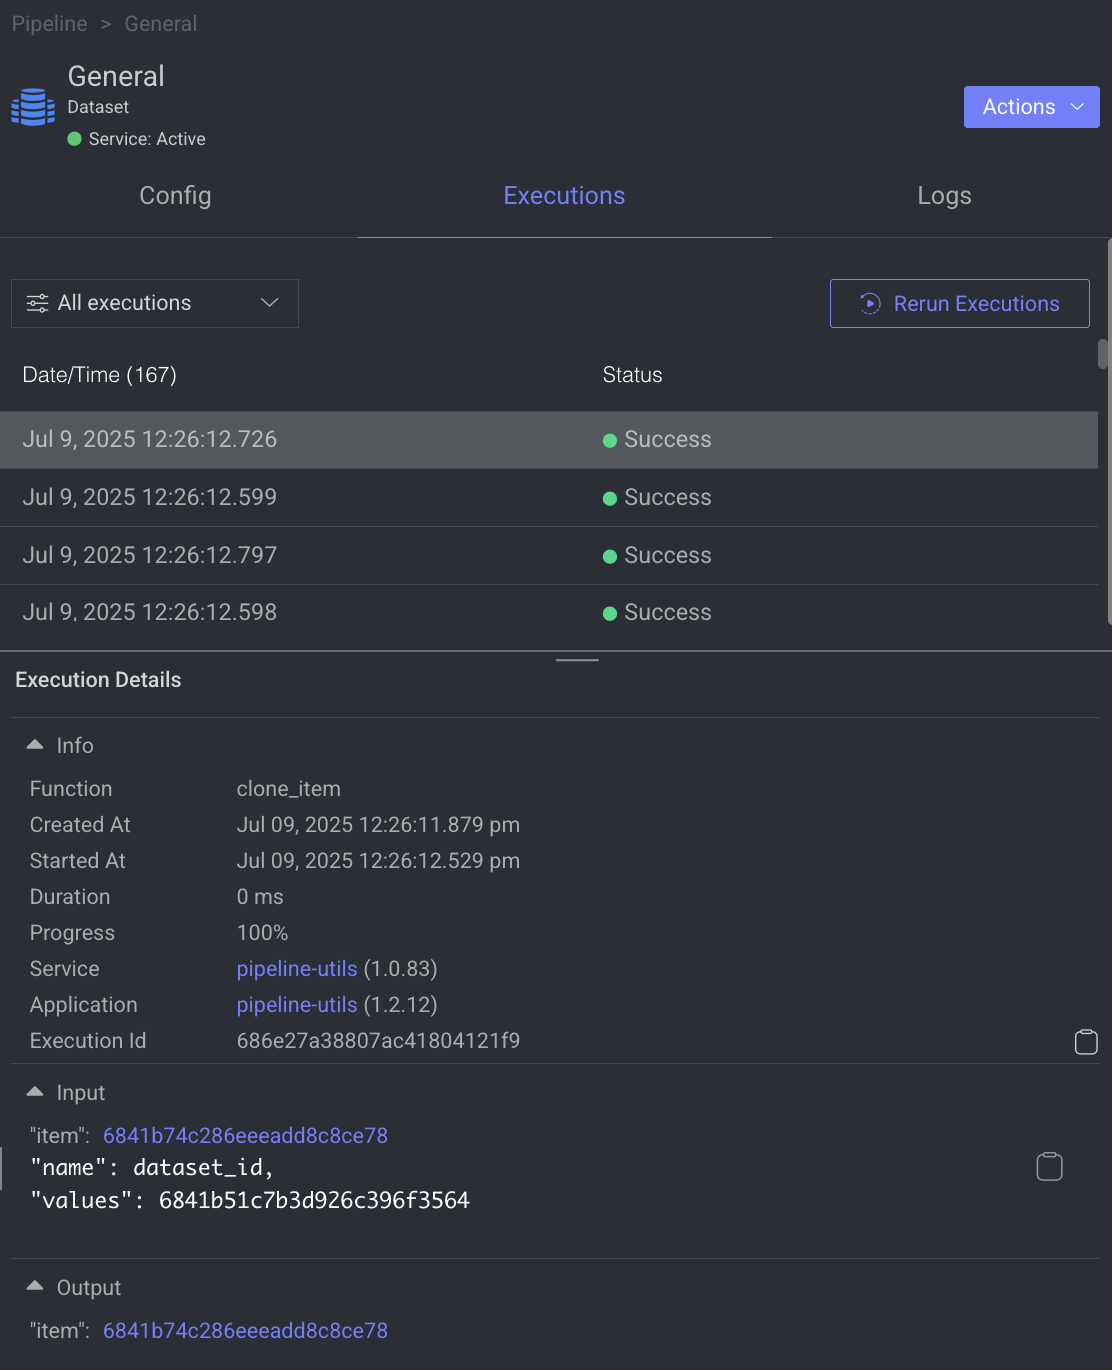
- Use the filter to display executions based on its status.
- Click Rerun Executions to rerun the selected executions. Before you confirm the rerun, you have two actions for the cycles:
- Resume Cycle: Resume the cycles of the selected executions starting from the current node onwards.
- Restart Cycle: Restart the cycles of the selected executions starting from the beginning.
- View Execution details such as Information, Input, and Output.
The Logs tab provides a granular view of what happens behind the scenes when a node executes.
- It showcases all log entries, including function and service level logs, application installation processes (from initialization to completion), generated during executions of the corresponding node within the selected time-frame.
- Dataloop stores logs for a maximum of 14 days.
- Click on the log to view log details in the bottom.
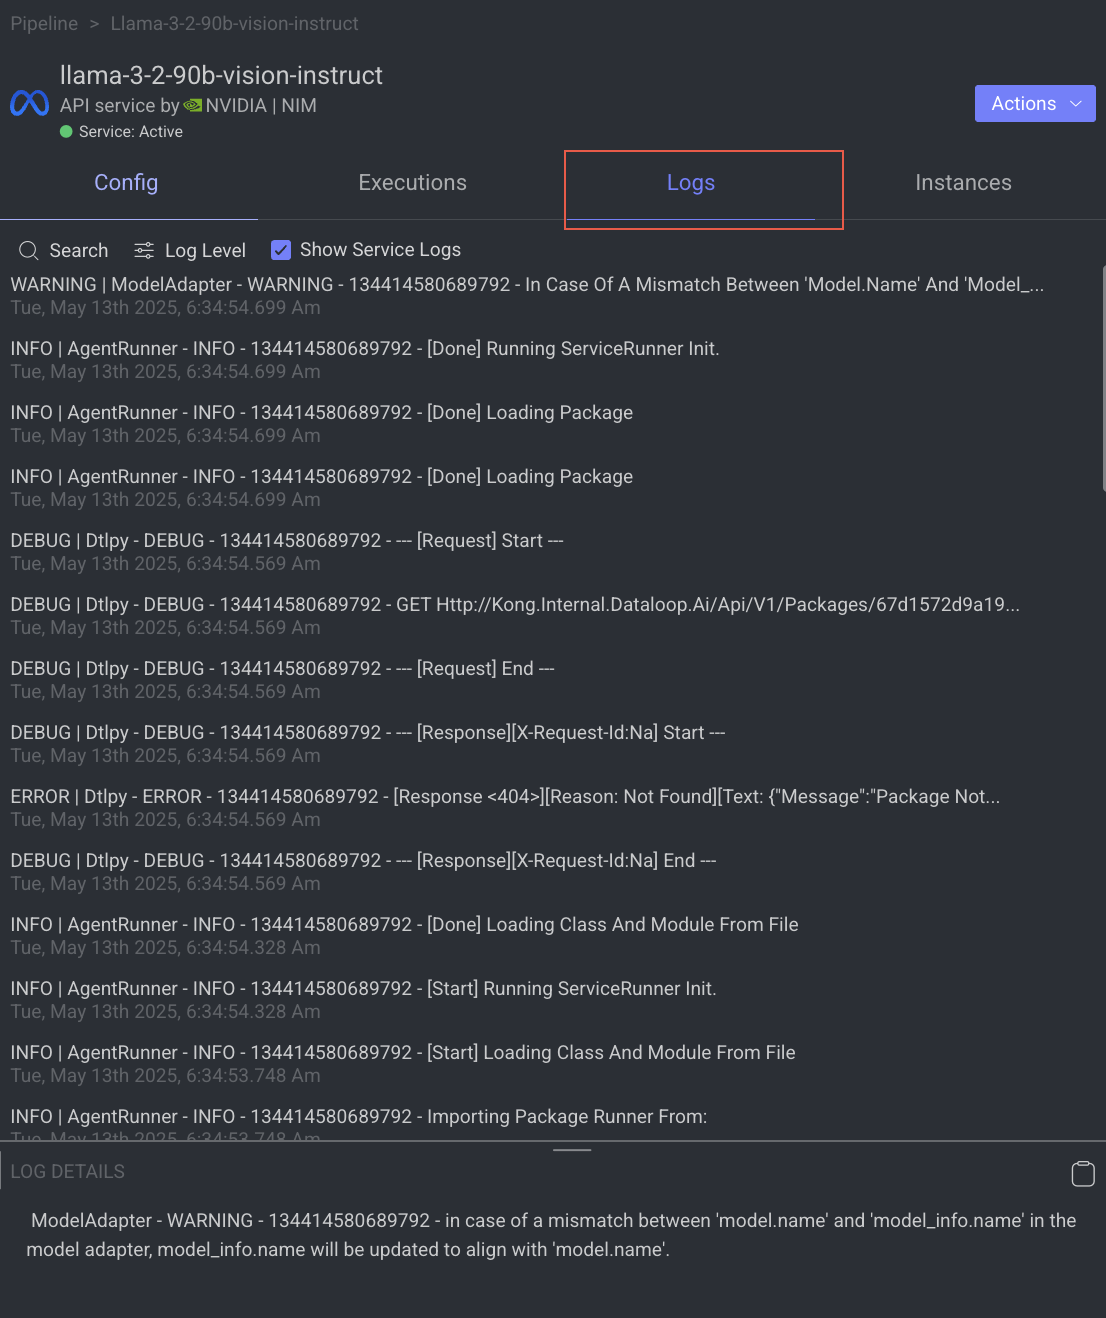
Utilize the following options to navigate through the logs:
- Search: Enter free text to search through the logs.
- Log Level Filter: Filter logs by selecting a level (critical, error, warning, info, debug) to find logs at that level and above.
- Show Service Logs: Show/hide service-level logs, aiding in the debugging and resolution of service-level errors and issues.
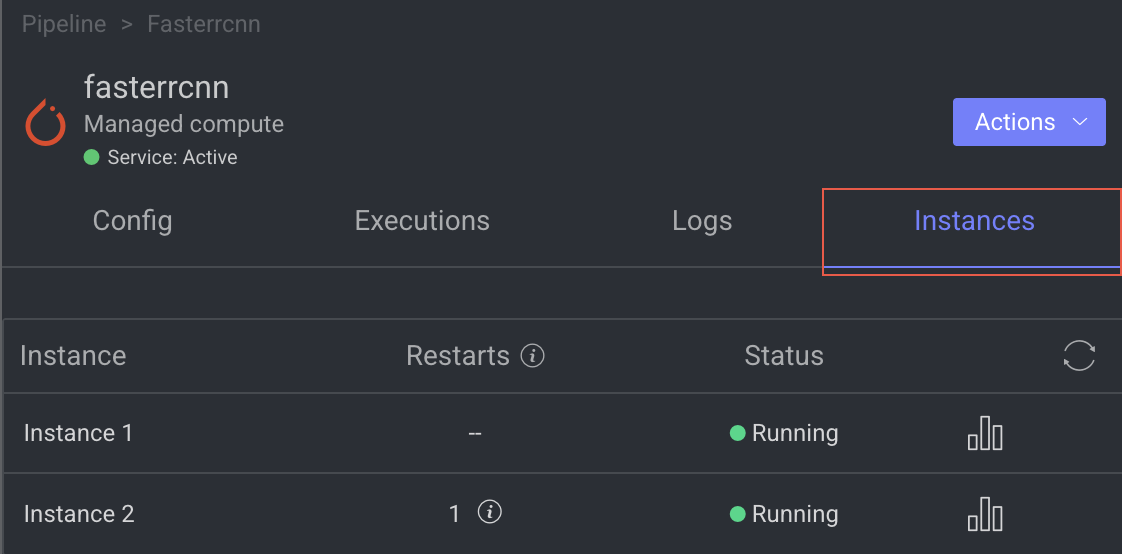
The Instance tab displays all available instances (replicas of services or machines) of the node service, along with their current status—such as 🟡 Initializing, 🟢 Running, or 🔴 Failed.
- It also indicates the number of restarts for each instance, which is useful for identifying services that are failing to activate and continuously restarting.
- Additionally, a monitoring icon is available for each instance. Clicking this icon redirects you to the Instances section of the Service page, where you can monitor detailed health metrics such as CPU and memory usage for each instance.
The Code node allows you to perform the following actions:

Edit Service Settings
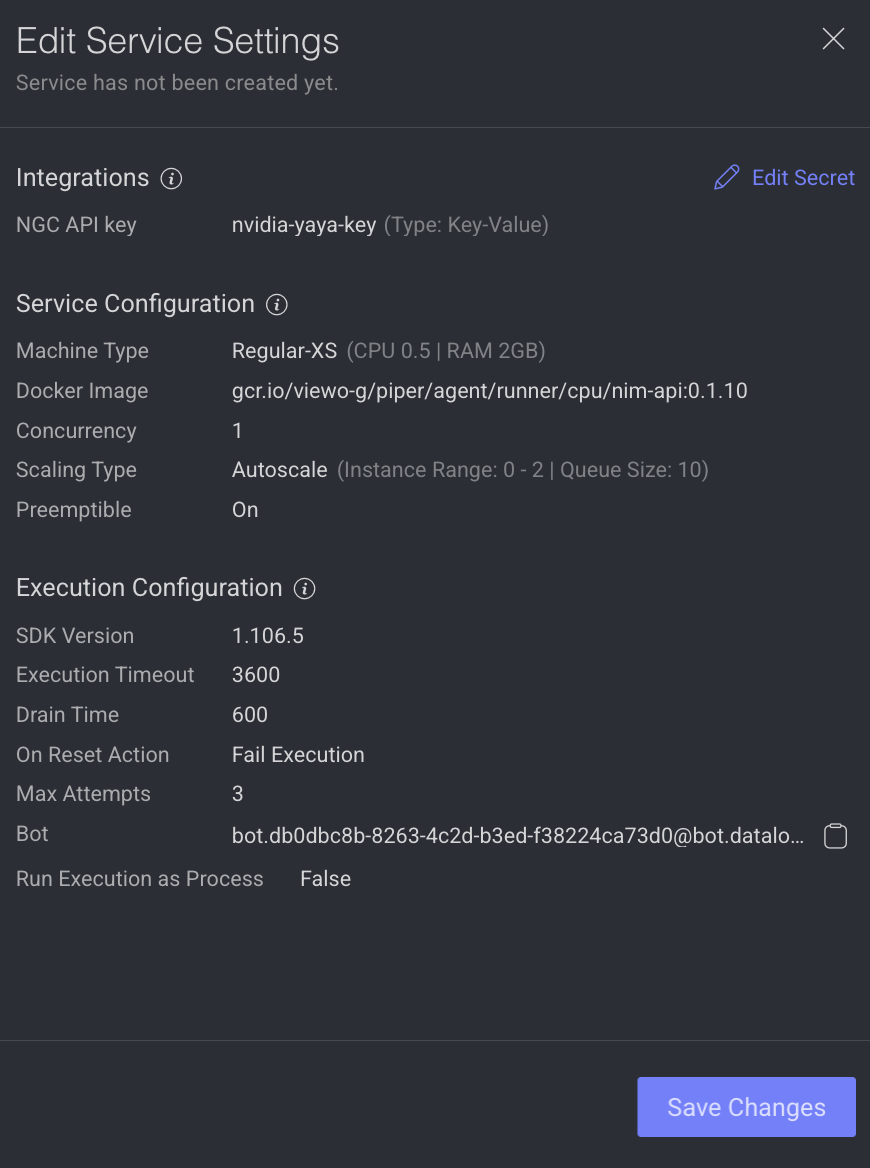
It allows you to make changes to the service settings like Integrations, Service Configuration, and Execution Configuration based on the model you have selected. This option is not available for Train and Validation.
You can now edit the service configuration of a node even while running a pipeline, providing greater flexibility.
- Open the Pipelines page and click on the pipeline from the list.
- Select the node from the pipeline.
- Click on the Action from the right-side panel.
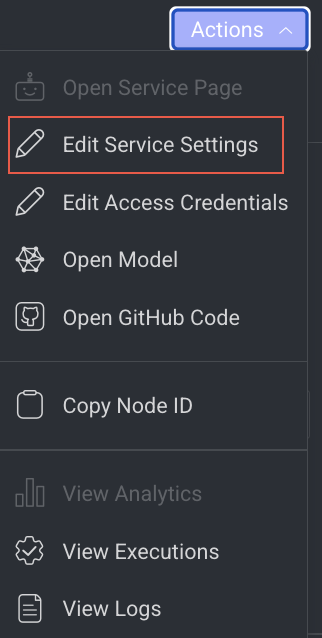
- Click Edit Service Settings from the list. The Edit Service Setting popup window of the service is displayed.
Integrations
The secret values are displayed, if the secret is defined in the dpk/dpkConfig. Click on the Edit Secret to search and select a secret from the list.
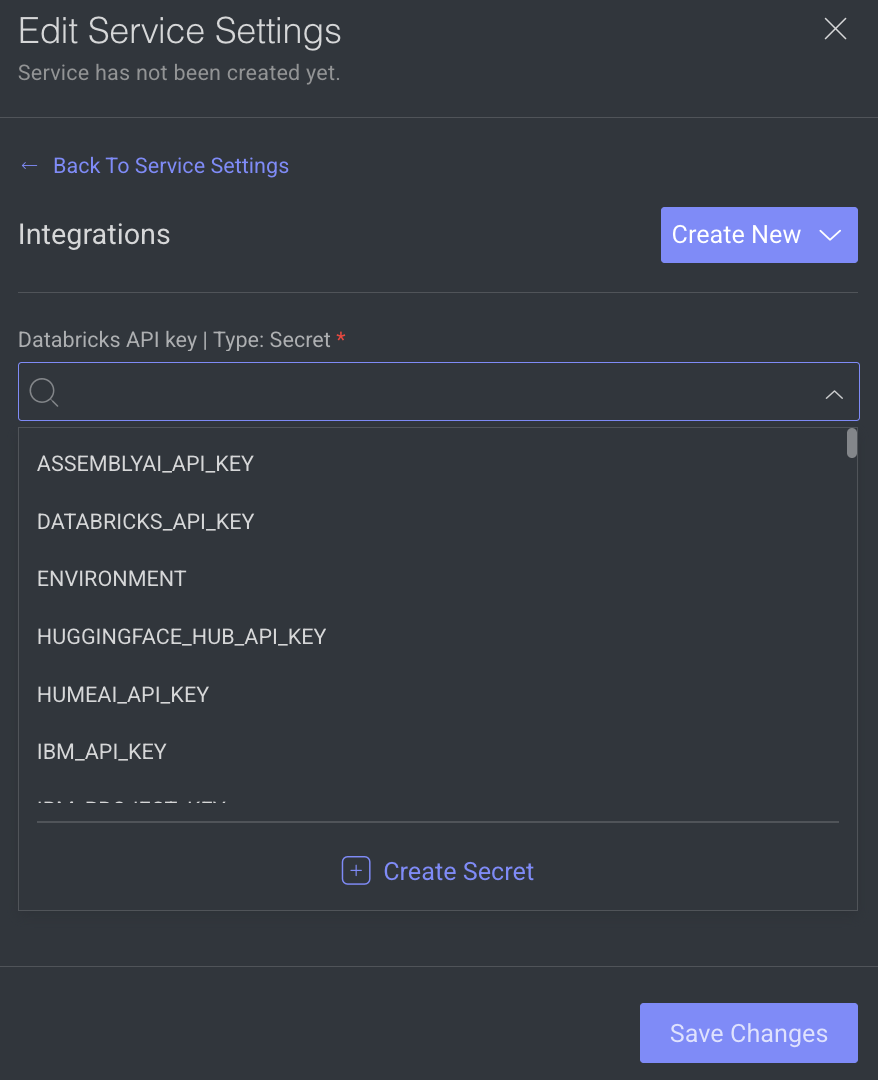
- To create a new secret, click Create New -> Create Secret.
- To create a new Integration, click Create New -> Create Integration.
- Click Save Changes, if no additional modifications are needed.
Service Configuration
The service configuration section allows making changes to the following parameters, to change, click on the Edit Configuration.
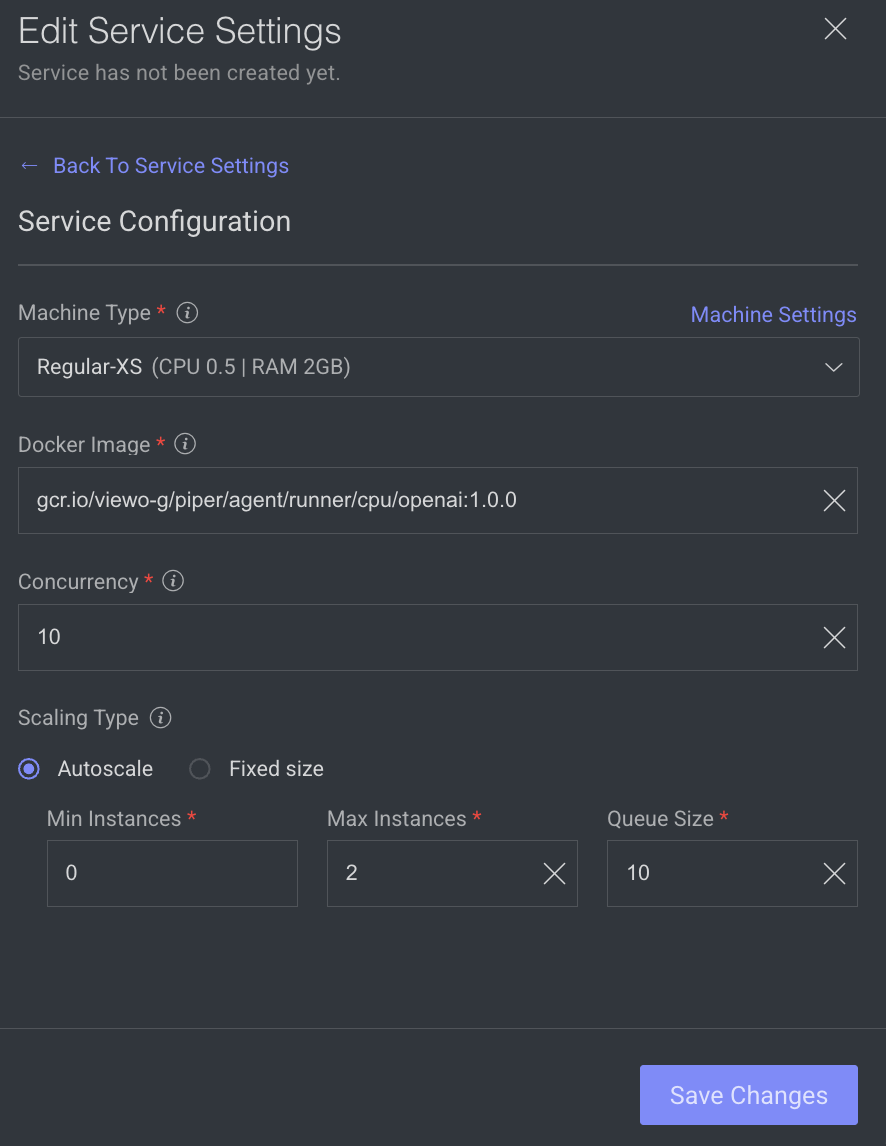
- Machine Types: The machine type on which the service will run (refers to CPU, GPU, RAM).
- Change the machine type from the list.
- Click on the Machine Settings to enable Preemptible Machine, the reclaimable compute instances.
- Docker Image: A container image encapsulating essential dependencies and code for service execution. By default, the docker image based on the SDK version is displayed. You can modify the URL as required.
- Concurrency: Number of concurrent executions per instance. By default, the value 10 is displayed.
- Scaling Type: Choose the scaling type based on your workload.
- Autoscale: Recommended by default. Autoscaling dynamically adjusts the number of service instances based on the incoming execution load, suitable for changing workloads. When autoscaler reduces instances, it waits for execution timeout before termination.
Min Instances: By default, 0. If you set the min instances to 0, the service will not run until it has something in the queue, it will be suspended.Max Instances: By Default, 2.Queue Size: By default, 10.
- Fixed size: Use fixed scaling when you need a predetermined number of service instances, suitable for consistent workloads. Compute hours counts also when there is no workload. By default, 1 instance is selected.
- Autoscale: Recommended by default. Autoscaling dynamically adjusts the number of service instances based on the incoming execution load, suitable for changing workloads. When autoscaler reduces instances, it waits for execution timeout before termination.
- Click Save Changes, if no additional modifications are needed.
Execution Configuration
The execution configuration section allows making changes to the following parameters, to change, click on the Edit Configuration.
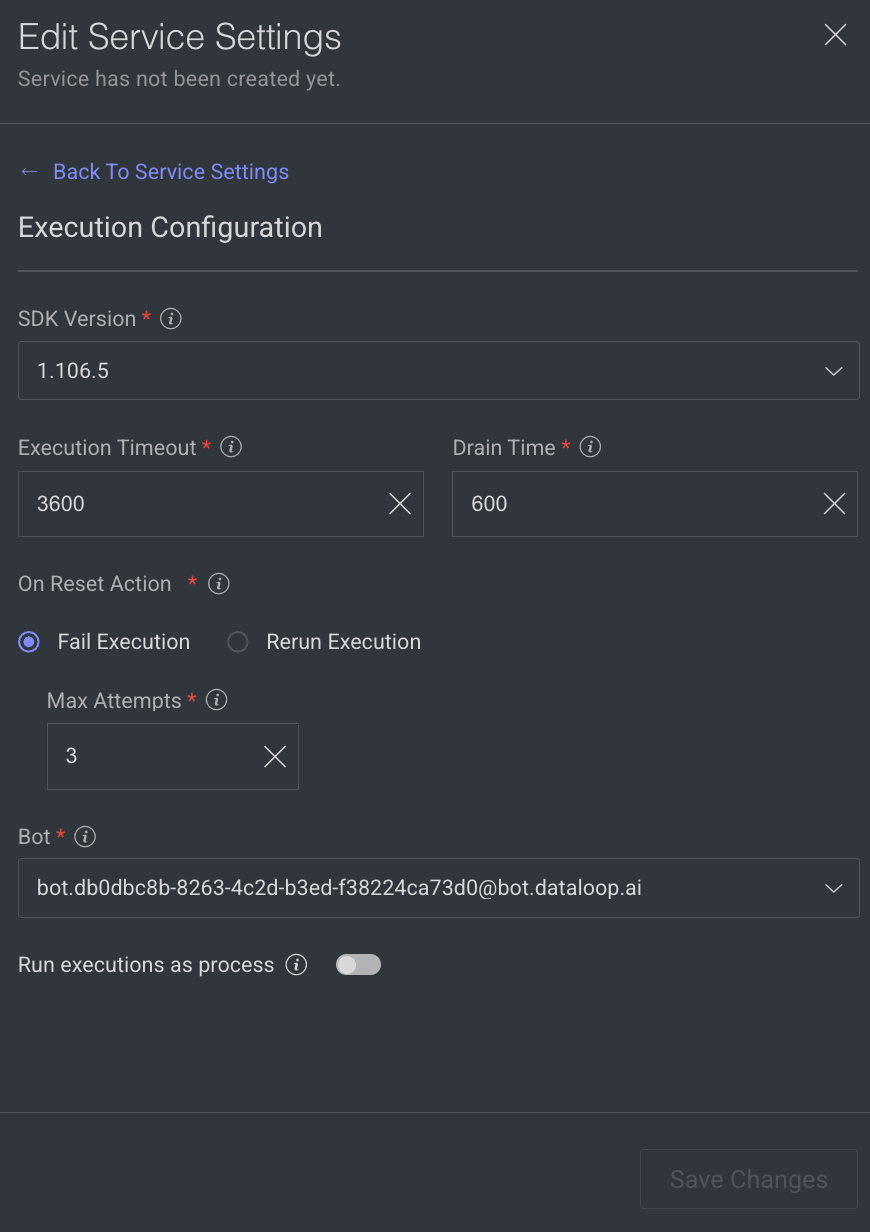
- SDK Version: The SDK version is displayed. Click to select a new version from the list.
- Execution Timeout: The maximum execution duration before service restarts (in seconds). By default, 3600 is displayed.
Drain Time: Delays service restart to complete ongoing executions (in seconds). By default, 600 is displayed.On Reset Action: Action taken when a service is reset or restarted (e.g. timeout). Select one of the following when you reset the execution.- Fail Execution
- Rerun Execution
Max Attempts: Configures to automatically retry failed executions up to x attempts. Maximum number of execution attempts allowed. By default, 3 is displayed.- Bot: A dummy user used for running the service ('developer' role). A default Bot is displayed. Select a new one from the list, if needed.
Rerun executions as process: Defines if each execution will start a new thread or a process. Enable to make the execution as a process.- Click Save Changes.
Copy the Node ID
Copy node ID of a pipeline node
- Open the Pipelines page and click on the pipeline from the list.
- Select the node from the pipeline.
- Click on the Action from the right-side panel.
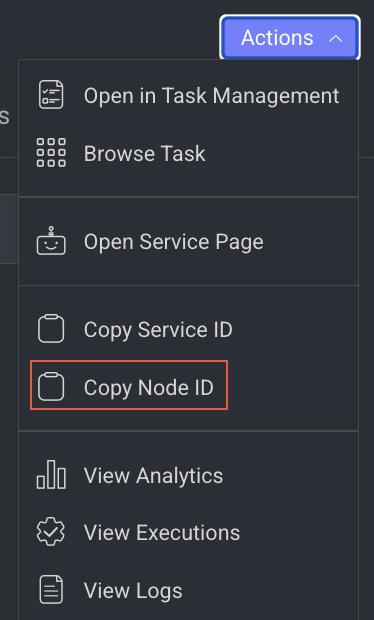
- Click Copy Node ID from the list.
View Execution Details
It allows you to view the Executions page of the Application Service.
- Open the Pipelines page and click on the pipeline from the list.
- Select the node from the pipeline.
- Click on the Action from the right-side panel.
- Click View Executions from the list. The Executions tab of the CloudOps Service page is displayed.
View Log Details
It allows you to view the Logs page of the Application Service from a pipeline node.
- Open the Pipelines page and click on the pipeline from the list.
- Select the node from the pipeline.
- Click on the Action from the right-side panel.
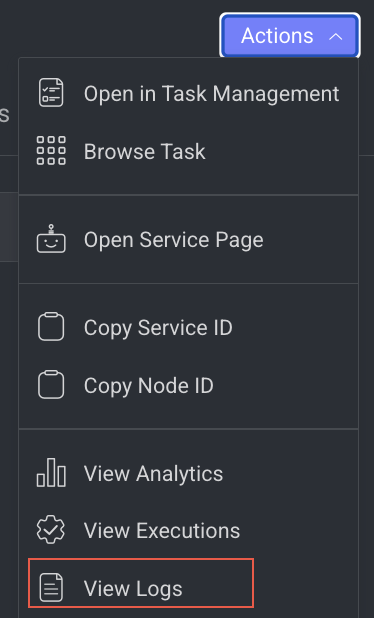
- Click View Logs from the list. The Logs tab of the CloudOps page is displayed.
App Function Node
The App Function Node allows you to run a deployed function from any Application, whether developed by your team or installed from the DDOE Marketplace -> Applications. Easily integrate reusable services into your pipeline. It's ideal for handling larger code scopes or reusable code across multiple pipelines, centralizing maintenance, version control, and providing control over computing settings and resource allocation. Learn more the Application.
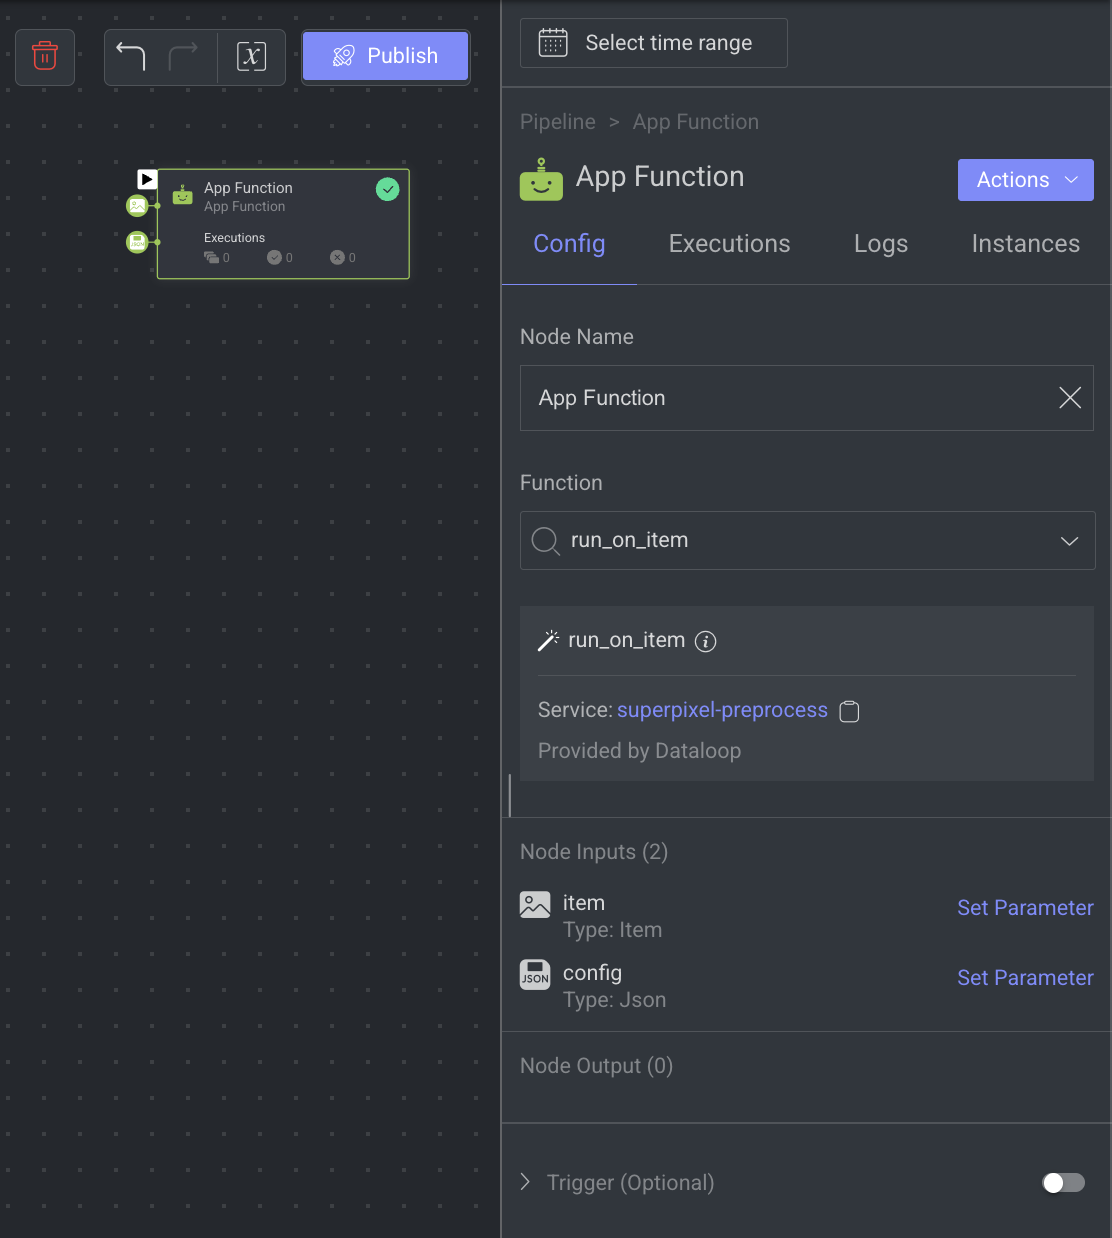
When you select an App Function node, its details, such as Configuration, Executions, Logs, Instances, and available actions are shown on the right-side panel.
Node Name: By default, App Function Node is displayed as name. You can change it accordingly.
Function: Select a function from the list. The App Function Node’s Output and Input channels are determined by the function chosen for the node.
Node Input: It is generated automatically according to the selected App Function.
Node Output: It is generated automatically according to the selected App Function.
Trigger (Optional): An Event/Cron Triggers can be set on this node, enabling you to initiate the pipeline run from this specific point.
When a node is selected, the Executions tab provides details about the execution of each item processed through that node.
- Choose a specific execution from the list to access its detailed information.
- Dataloop stores executions for a maximum of 90 days.
- Use the filter to display executions based on its status.
- Click Rerun Executions to rerun the selected executions. Before you confirm the rerun, you have two actions for the cycles:
- Resume Cycle: Resume the cycles of the selected executions starting from the current node onwards.
- Restart Cycle: Restart the cycles of the selected executions starting from the beginning.
- View Execution details such as Information, Input, and Output.
The Logs tab provides a granular view of what happens behind the scenes when a node executes.
- It showcases all log entries, including function and service level logs, application installation processes (from initialization to completion), generated during executions of the corresponding node within the selected time-frame.
- Dataloop stores logs for a maximum of 14 days.
- Click on the log to view log details in the bottom.
Utilize the following options to navigate through the logs:
- Search: Enter free text to search through the logs.
- Log Level Filter: Filter logs by selecting a level (critical, error, warning, info, debug) to find logs at that level and above.
- Show Service Logs: Show/hide service-level logs, aiding in the debugging and resolution of service-level errors and issues.
The Instance tab displays all available instances (replicas of services or machines) of the node service, along with their current status—such as 🟡 Initializing, 🟢 Running, or 🔴 Failed.
- It also indicates the number of restarts for each instance, which is useful for identifying services that are failing to activate and continuously restarting.
- Additionally, a monitoring icon is available for each instance. Clicking this icon redirects you to the Instances section of the Service page, where you can monitor detailed health metrics such as CPU and memory usage for each instance.
The App Function node allows you to perform the following actions:
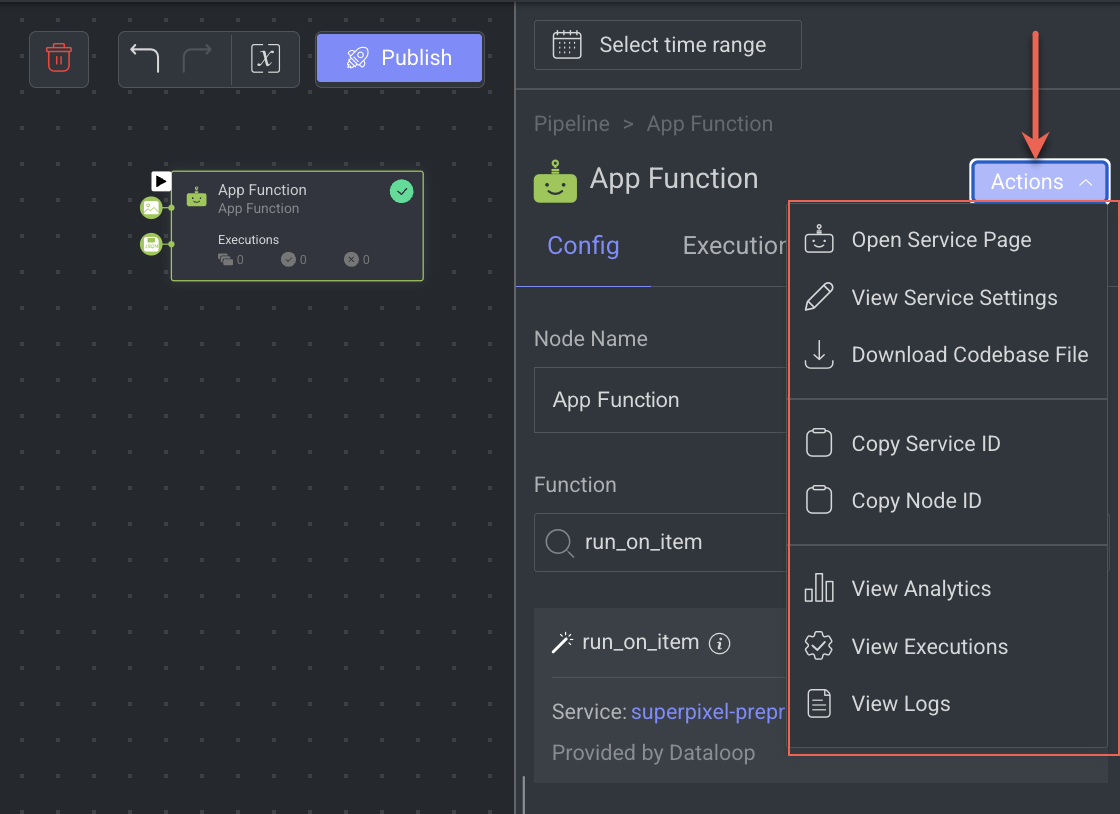
Open the Service Page
Open the service page of a pipeline node where you can see Monitoring, Executions, Logs, Triggers, and Instances information of the service. It will be available once you set a model.
- Open the Pipelines page and click on the pipeline from the list.
- Select the node from the pipeline.
- Click on the Action from the right-side panel.
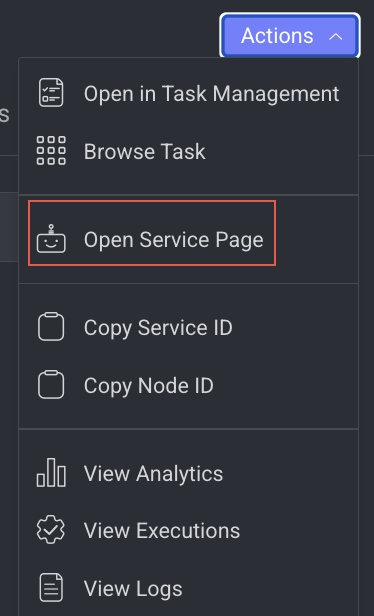
- Click Open Service Page from the list. The Monitoring tab of the service page is displayed.
View Service Settings
It allows you to view the Service Settings based on the model you have selected while running the pipeline.
Open the Pipelines page and click on the pipeline from the list.
Select the node from the pipeline.
Click on the Action from the right-side panel.

Click View Service Settings from the list. The View Service Setting popup window of the service is displayed.
Download the Codebase File
It allows you to download the Codebase file for a App Function node. To learn how to download, see the Codebase.
Open the Pipelines page and click on the pipeline from the list.
Select the App Function node from the pipeline.
Click on the Action from the right-side panel.

Click Download Codebase File from the list. The codebase package file will be downloaded, if you have the permission.
Copy the Service ID
Copy service ID from a pipeline node.
- Open the Pipelines page and click on the pipeline from the list.
- Select the node from the pipeline.
- Click on the Action from the right-side panel.
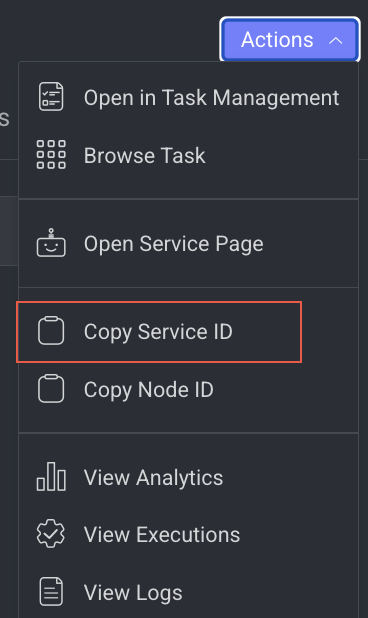
- Click Copy Service ID from the list.
Copy the Node ID
Copy node ID of a pipeline node
- Open the Pipelines page and click on the pipeline from the list.
- Select the node from the pipeline.
- Click on the Action from the right-side panel.
- Click Copy Node ID from the list.
View Log Details
It allows you to view the Logs page of the Application Service from a pipeline node.
- Open the Pipelines page and click on the pipeline from the list.
- Select the node from the pipeline.
- Click on the Action from the right-side panel.
- Click View Logs from the list. The Logs tab of the CloudOps page is displayed.
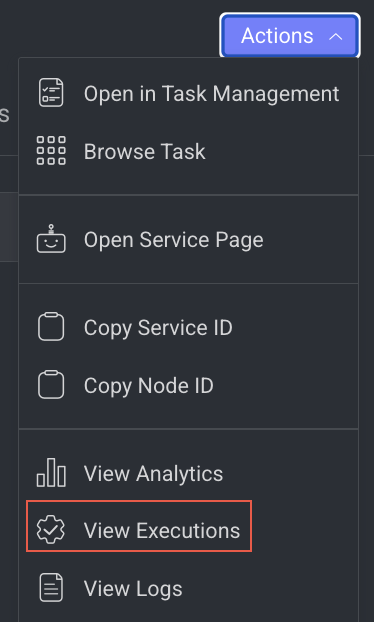
View Execution Details
It allows you to view the Executions page of the Application Service.
- Open the Pipelines page and click on the pipeline from the list.
- Select the node from the pipeline.
- Click on the Action from the right-side panel.
- Click View Executions from the list. The Executions tab of the CloudOps Service page is displayed.
View Analytics Details
It allows you to view the Monitoring tab of the Application Service.
- Open the Pipelines page and click on the pipeline from the list.
- Select the node from the pipeline.
- Click on the Action from the right-side panel.
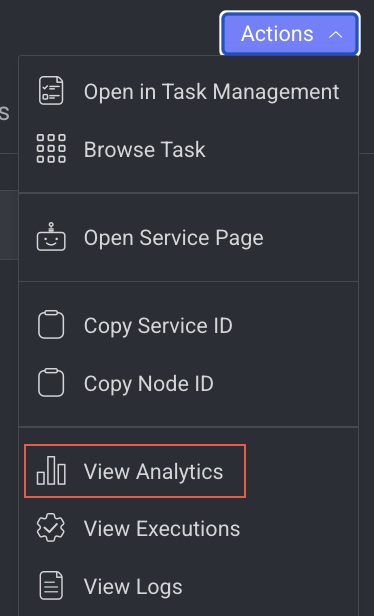
- Click View Analytics from the list. The Monitoring tab of the Application Service page is displayed.